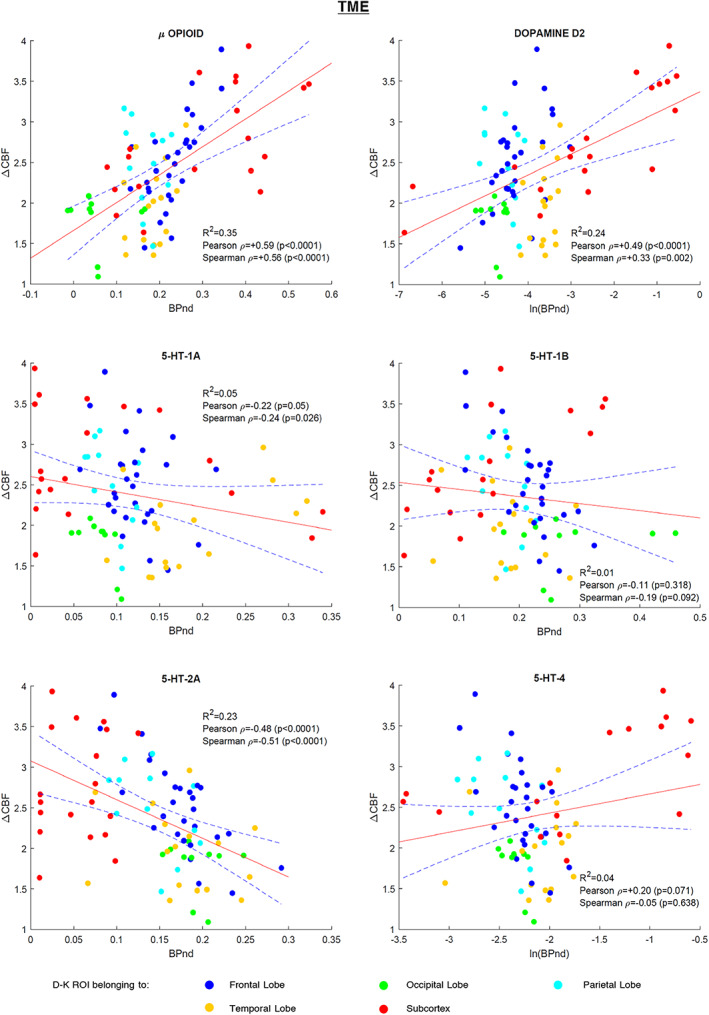
FIGURE 3.

TME study regression plots: Scatterplots of the 85 VOIs (dots) displaying the relationship of the average regional CBF change (ΔCBF) between pain and non‐pain states of TME dataset with average regional BPnd values of the six receptor templates utilised. The linear regression curve (red line) and 95% confidence bounds (dashed lines) are shown. The dots are presented color‐coded as shown in the figure legend to provide a coarse positioning of the VOIs into the brain. BPnd, binding potential; CBF, cerebral blood flow; TME, third molar extraction; VOI, volumes of interest
