

Abstract
The adolescent brain undergoes tremendous structural and functional changes throughout puberty. Previous research has demonstrated that pubertal hormones can modulate sexually dimorphic changes in cortical development, as well as age‐related maturation of the neural activity underlying cognitive processes. However, the precise impact of pubertal hormones on these functional changes in the developing human brain remains poorly understood. In the current study, we quantified the neural oscillatory activity serving visuospatial processing using magnetoencephalography, and utilized measures of dehydroepiandrosterone (DHEA) as an index of development during the transition from childhood to adolescence (i.e., puberty). Within a sample of typically developing youth (ages 9–15), a novel association between pubertal DHEA and theta oscillatory activity indicated that less mature children exhibited stronger neural responses in higher‐order prefrontal cortices during the visuospatial task. Theta coherence between bilateral prefrontal regions also increased with increasing DHEA, such that network‐level theta activity became more distributed with more maturity. Additionally, significant DHEA‐by‐sex interactions in the gamma range were centered on cortical regions relevant for attention processing. These findings suggest that pubertal DHEA may modulate the development of neural oscillatory activity serving visuospatial processing and attention functions during the pubertal period.
Keywords: hormones, magnetoencephalography, puberty, theta, visuospatial attention
1. INTRODUCTION
The adolescent brain is subject to major structural and functional changes throughout puberty. These developmental processes are in part mediated by steroid hormones, which after a period of quiescence in early childhood, reemerge during two distinct neuroendocrine events (i.e., gonadarche and adrenarche; Byrne et al., 2017; Sisk & Foster, 2004). Adrenarche is one of the earliest phases of postnatal neuroendocrine development where the unique hormonal milieu of puberty begins to emerge (Byrne et al., 2017; Nguyen, 2017). During this period of late childhood, production of dehydroepiandrosterone (DHEA) and its sulfate ester DHEAS substantially increases (Campbell, 2006; Maninger et al., 2009; Neunzig & Bernhardt, 2014; Racchi et al., 2003). Concentrations of DHEA continue to rise through early adulthood, which suggests that the developmental function of this steroid extends both during and well beyond the pubertal transition (Campbell, 2006). DHEA also acts as a crucial precursor in the synthesis of testosterone and estradiol, hormones that characteristically rise later in adolescence to uniquely facilitate sexually dimorphic patterns of development during gonadarche (Blakemore et al., 2010; Nguyen et al., 2013; Reman & Carr, 2004; Sisk & Foster, 2004; Witte et al., 2010). Despite these downstream functions, DHEA remains one of the most abundant steroids in human circulation throughout the lifespan and uniquely impacts developmental processes independent of the gonadal hormones (Campbell, 2006; Corpéchot et al., 1981; Neunzig & Bernhardt, 2014; Nguyen, 2017; Racchi et al., 2003).
DHEA and other pubertal hormones have been shown to be strong modulators of anatomical cortical development through their influence on neurogenesis, neuronal growth and differentiation, and neuroprotection by directly interacting with sex‐steroid receptors (Ahmed et al., 2008; Campbell, 2006; Davis et al., 1996; Maninger et al., 2009; Nuñez et al., 2002; Quinn et al., 2018). In fact, concentrations of DHEA in the brain are larger than any other organ, including the adrenals (Corpéchot et al., 1981). During puberty, these hormones have shown region‐ and sex‐specific influences on gray and white matter development (Bramen et al., 2012; Goddings et al., 2019; Koolschijn et al., 2014; Neufang et al., 2009; Nguyen, 2017; Nguyen et al., 2013; Paus et al., 2010). Importantly, prior work has highlighted the independent actions of DHEA on cortical development in several brain regions, including areas that support visual and attention networks (Nguyen, 2017; Nguyen et al., 2013). Of note, overall patterns of structural growth are similar in both males and females, with white matter increasing linearly over time and gray matter increasing until its peak in late childhood and thinning thereafter (Giedd et al., 1999; Herting & Sowell, 2017; Wierenga et al., 2014). However, these peaks in cortical development vary between males and females, with some of these sex‐specific developmental patterns likely emerging as a result of changing pubertal hormone levels (De Bellis et al., 2001; Giedd et al., 1999). Finally, other measures of physical maturation during puberty indicate that children in later stages of pubertal development have smaller gray matter volumes in various cortical and subcortical regions than prepubescent children (Bramen et al., 2012; Koolschijn et al., 2014; Peper et al., 2009; Vijayakumar et al., 2018).
While changes to cortical structure during puberty are well documented, especially within the fronto‐parietal regions (Gogtay et al., 2004; Sowell et al., 2001; Vijayakumar et al., 2018), associations between sex steroids and functional cognitive development are less understood, as most studies focus on pubertal changes in social, emotional, and reward processing (for review, see Vijayakumar et al., 2018). More commonly, studies examine associations between indices of brain function and chronological age, sometimes incorporating interactions between age and sex (Rubia et al., 2010). However, several studies have noted unique effects of pubertal hormones on neurocognitive functioning above and beyond the effects of chronological age, particularly with respect to cognitive functions served by hormone‐sensitive frontoparietal networks. For example, functional magnetic resonance imaging (MRI) studies have found that pubertal hormones are associated with memory performance and executive functioning above and beyond the effects of age (Cservenka et al., 2015; Selmeczy et al., 2019). Still, despite the known effects of sex steroids on frontoparietal cortical structure and function, minimal work has examined the role of pubertal hormones in the development of brain function serving visuospatial processing and attentional abilities, especially in the context of neural oscillatory activity.
Visuospatial attention networks are located bilaterally in the frontal, parietal, and occipital cortices, and activity in these nodes allows for the detection of salient stimuli in the visual field (Corbetta and Schulman, 2002; Petersen & Posner, 2012; Posner & Petersen, 1990). The networks serving visuospatial processing are associated with distinct neural oscillatory signatures within the theta, alpha, and gamma frequency bands (Lew et al., 2020; Wiesman et al., 2017, 2018). These responses vary with both age and sex (Wiesman & Wilson, 2019), though little is known about these oscillations during adolescence. Age‐related changes in oscillatory activity among youth have been reported across several domains, such as motor development (Heinrichs‐Graham et al., 2018, 2020; Trevarrow et al., 2019) and visual processing (Fung et al., 2020), and significant sex‐by‐age interactions have been observed for various executive functions (Embury et al., 2019; Taylor et al., 2020). More specifically, previous work has found significant sex‐by‐age interactions in the neural oscillations serving visuospatial and attention processing, reflecting developmental differences between the sexes in these critical brain responses (Killanin et al., 2020; Taylor et al., 2021). Given the vast impact of pubertal hormones on the brain, there is a clear need to also parse the effects of chronological age and pubertal maturation on neurophysiological development, especially due to the significant variation in the timing and tempo of pubertal change (Blakemore et al., 2010; Sisk & Foster, 2004). Interestingly, one recent study used endogenous testosterone as a metric for development and found sexually dimorphic maturational changes in oscillatory activity serving visual and attentional networks; these effects were above and beyond those of chronological age (Fung et al., 2020). These findings suggest that direct measures of endogenous sex hormones may provide insight into a unique axis of development that may modulate the neural oscillatory dynamics serving high order cognition.
Along the same line, the present study assessed developmental changes in the neural oscillations serving visuospatial processing, as indexed by endogenous DHEA levels, in a sample of typically developing children and adolescents. DHEA levels consistently increase across the pubertal transition and enact developmental effects independent of testosterone and estradiol (Nguyen, 2017); thus, rising levels of this adrenal androgen can independently serve as a reliable metric of pubertal maturation in both males and females (Root, 1973; Shirtcliff et al., 2009). To this end, all participants completed a visuospatial discrimination task during magnetoencephalography (MEG) and the resulting neural responses were transformed into the time‐frequency domain and imaged using a beamforming approach. The effects of DHEA on visuospatial processing and attention dynamics were assessed through whole‐brain voxel‐based analyses of oscillatory activity and DHEA levels, while controlling for age. These developmental trajectories were also examined for sex differences. Based on the existing literature, we hypothesized that DHEA levels would be coupled to neural oscillatory activity in visuospatial processing and attention networks in the brain, above‐and‐beyond the effects of chronological age alone. We further expected to see sex differences in oscillatory activity given the differential effects of sex steroids on males and females during puberty, and previous findings of sexually dimorphic patterns of oscillatory development.
2. MATERIALS AND METHODS
2.1. Participants
Thirty‐five typically developing children and adolescents ages 9–15 years completed a visuospatial discrimination task and provided saliva samples for hormonal analyses as part of the National Science Foundation‐funded Developmental Chronnecto‐Genomics study (Stephen et al., 2021). All participants were recruited from the University of Nebraska Medical Center (UNMC) site. Of note, portions of this sample and raw MEG data have been previously published (Fung et al., 2020), though the present manuscript utilized a different index of development (i.e., DHEA) and a complete reanalysis of all MEG data. Exclusionary criteria included neurological or psychiatric disorder, history of head trauma, and general MEG/MRI exclusionary criteria such as the presence of metal implants, dental braces or permanent retainers, or other metallic or otherwise magnetic nonremovable devices. All procedures were approved by the UNMC Institutional Review Board, and informed consent from the child's parent or legal guardian, as well as assent from the child, were obtained before proceeding with the study.
2.2. Procedure
2.2.1. Salivary DHEA collection and measurement
Hormone analyses utilized the same methodology as a previous study (Fung et al., 2020), except DHEA was quantified instead of testosterone. At least 2.0 ml of whole unstimulated saliva was collected from each participant. Specifically, children were asked to passively drool into an Oragene DISCOVER (OGR‐500; www.dnagenotek.com) collection tube until liquid saliva (not bubble) exceeded the fill line indicated on the tube. A single‐channel pipette was then used to extract 0.5 ml from the collection tube (prior to the release of the protease inhibitors for long‐term storage), and this 0.5 ml was immediately transferred into a labeled microcentrifuge tube and placed in a −20°C freezer for storage. Participants were instructed to refrain from consuming any food, liquids, or chewing gum for at least an hour before providing the saliva sample, and generally completed the study in the afternoon (M Time = 16:15, SD = 3.08 h). All samples were assayed in duplicate using a commercially available assay kit for salivary DHEA (Salimetrics; www.salimetrics.com) by the University of Nebraska Lincoln Salivary Biosciences Laboratory. The assay kit had a sensitivity of 5 pg/ml, with a range of 10.2–1000 pg/ml. The intra‐ and inter‐assay coefficients of variation were 7.95% and 10.17%, respectively. The average of the duplicate tests were used for further analyses in the present study. DHEA levels three standard deviations above or below the group mean were excluded from subsequent analyses.
2.2.2. Task paradigm
A visuospatial discrimination task, termed Vis‐Attend, was used to engage the visuospatial processing circuitry (Wiesman et al., 2017; Figure 1). During this task, participants were told to fixate on a centrally presented crosshair. After a variable ISI (range: 1900–2100 ms), an 8 × 8 grid was presented for 800 ms at one of four positions relative to the fixation: above and to the right, below right, above left, or below left. The left and right orientations were defined as a lateral offset of 75% of the grid from the center of fixation. Participants were instructed to press a button with their right hand to indicate whether the grid was positioned to the left (index finger) or right (middle finger) of the fixation point upon presentation of the grid. Each participant performed 240 trials (60 of each type) in a pseudo‐randomized order concurrent with MEG recording. Responses with a reaction time 2.5 standard deviations above or below the participant's mean were excluded prior to averaging.
FIGURE 1.
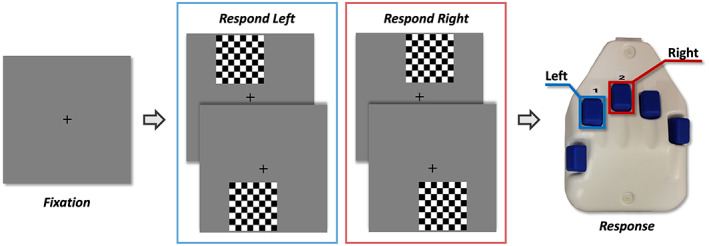
Visuospatial task paradigm (Vis‐attend). Each trial consisted of two periods: (1) fixation lasting an average of 2000 ms (1900–2100 ms variable ISI) with a 400‐ms baseline period, and (2) an 800 ms stimulus‐presentation period with the grid appearing in one of four locations. Participants indicated the lateral location of the stimulus grid relative to the fixation with a button press (left or right)
2.2.3. MEG data acquisition
MEG data acquisition, structural coregistration, preprocessing, and sensor‐/source‐level analyses closely followed the analysis pipeline of several previous manuscripts (Heinrichs‐Graham et al., 2018; Killanin et al., 2020; Spooner et al., 2020; Wiesman & Wilson, 2019, 2020); Wiesman et al., 2017. MEG recordings were conducted in a one‐layer magnetically shielded room with active shielding engaged. Neuromagnetic responses were acquired in continuous mode with an Elekta/MEGIN MEG system with 306 magnetic sensors (204 planar gradiometers, 102 magnetometers; Elekta/MEGIN, Helsinki, Finland) using a bandwidth of 0.1–330 Hz and a sampling rate of 1 kHz. Each participant's data were individually corrected for head motion, and noise reduction was applied using the signal space separation method with a temporal extension (tSSS; Taulu & Simola, 2006; Taulu et al., 2005).
2.2.4. MEG Coregistration and structural MRI processing
Preceding MEG measurement, four coils were attached to the participant's head and localized, together with the three fiducial points and scalp surface, using a 3D digitizer (Fastrak 3SF0002, Polhemus Navigator Sciences, Colchester, VT). Once the participant was positioned for MEG recording, an electric current with a unique frequency label (e.g., 322 Hz) was fed to each of the coils. This induced a measurable magnetic field and allowed each coil to be localized in reference to the sensors throughout the recording session. Since coil locations were also known in head coordinates, all MEG measurements could be transformed into a common coordinate system. With this coordinate system, each participant's MEG data were coregistered with their individual structural T1‐weighted MRI data prior to source space analyses using BESA MRI (Version 2.0). Structural T1‐weighted MRI data were acquired using a Siemens Skyra 3 T MRI scanner with a 32‐channel head coil and a MP‐RAGE sequence with the following parameters: TR = 2400 ms; TE = 1.94 ms; flip angle = 8°; FOV = 256 mm; slice thickness = 1 mm (no gap); voxel size = 1 × 1 × 1 mm. These data were aligned parallel to the anterior and posterior commissures and transformed into standardized space. Following source reconstruction (i.e., beamforming), each participant's 4.0 × 4.0 × 4.0 mm functional images were also transformed into standardized space using the transform that was previously applied to the structural MRI volume and spatially resampled.
2.2.5. MEG time‐frequency transformation and statistics
Cardiac and ocular artifacts were removed from the data using signal‐space projection, which was accounted for during source reconstruction (Uusitalo & Ilmoniemi, 1997). The continuous magnetic time series was divided into epochs of 2700 ms duration, with the baseline extending from −400 to 0 ms before stimulus onset. Epochs containing artifacts (e.g., eye blinks, muscle artifacts, eye saccades, swallowing, coughing) were rejected based on a fixed‐threshold method, supplemented with visual inspection. Notably, thresholds were set independently for each participant due to differences among individuals in head size and sensor proximity, which strongly affect MEG signal amplitude. To calculate these thresholds, the trial‐wise amplitude distribution was plotted for each MEG sensor per participant, and the highest amplitude values relative to the participant's total distribution were identified Next, in order to reject artefactual trials, this set amplitude threshold was adjusted to only exclude extreme amplitude values relative to each participant's amplitude distribution. This same process was repeated for gradient values, and trials containing artefactual amplitude and/or gradient values were removed and excluded from subsequent analyses. After artifact rejection, an average of 187.42 (SD = 20.8) trials per participant were used for further analysis; this number was not significantly correlated with age or DHEA levels, and did not differ by sex.
Artifact‐free epochs were transformed into the time‐frequency domain using complex demodulation (Kovach & Gander, 2016; Papp & Ktonas, 1977), and the resulting spectral power estimations per sensor were averaged over trials to generate time‐frequency plots of mean spectral density. These sensor‐level data were normalized using the respective bin's baseline power, which was calculated as the mean power during the −400 to 0 ms time period. The specific time‐frequency windows used for imaging were determined by statistical analysis of the sensor‐level spectrograms across the entire array of gradiometers. To reduce the risk of false‐positive results while maintaining reasonable sensitivity, a two‐stage procedure was followed to control for Type 1 error. In the first stage, two‐tailed paired‐sample t‐tests against baseline were conducted on each data point, and the output spectrograms of t‐values were thresholded at p < .05 to define time‐frequency bins containing potentially significant oscillatory deviations across all participants. In stage two, the time‐frequency bins that survived the threshold were clustered with temporally and/or spectrally neighboring bins that were also below the p < .05 threshold, and a cluster value was derived by summing all the t‐values of all data points in the cluster. Nonparametric permutation testing was then used to derive a distribution of cluster values and the significance level of the observed clusters (from stage one) was tested directly using this distribution (Ernst, 2004; Maris & Oostenveld, 2007). For each comparison, 1000 permutations were computed to build a distribution of cluster values. Based on these analyses, the time‐frequency windows that contained significant oscillatory events across all participants were subjected to a beamforming analysis (see Results). Of note, to ensure the optimal time‐frequency windows were chosen for subsequent analyses, we also computed sensor‐level spectrograms with the phase‐locked component subtracted from the total response amplitude (Figure S1). Finally, time‐frequency clusters that became significant after the mean reaction time across all participants were not considered in further analyses, as the aims of the study were to focus on visuospatial processing rather than other processes involved in task completion (e.g., motor initiation, response/error‐checking, etc.).
2.2.6. MEG source imaging and statistics
Cortical responses were imaged through an extension of the linearly constrained minimum variance vector beamformer (Gross et al., 2001; Hillebrand et al., 2005; Van Veen et al., 1997), which employs spatial filters in the time‐frequency domain to calculate source power and/or coherence for the entire brain volume. The single images are derived from the cross‐spectral densities of all combinations of MEG gradiometers averaged over the time‐frequency range of interest, and the solution of the forward problem for each location on a grid specified by input voxel space. Following convention, we computed noise‐normalized, source power and (separately) voxel wise coherence in each participant using active (i.e., task) and passive (i.e., baseline) periods of equal duration and bandwidth (Hillebrand et al., 2005). For neural response power, such images are typically referred to as pseudo‐t maps, with units (pseudo‐t) that reflect noise‐normalized power differences (i.e., active vs. passive) per voxel. In contrast, coherence images reflect noise‐normalized changes in connectivity from baseline levels between a prespecified seed voxel of interest and every other voxel in the brain. MEG preprocessing and imaging used the Brain Electrical Source Analysis (BESA V7.0) software. Further details about our MEG data processing pipeline are available in a recent publication (Wiesman & Wilson, 2020).
Normalized differential source power was computed for the statistically selected time‐frequency bands (see below) over the entire brain volume per participant at 4.0 × 4.0 × 4.0 mm resolution. The resulting 3D maps of brain activity were then averaged across participants to assess the neuroanatomical basis of the significant oscillatory responses identified through the sensor‐level analysis. Next, whole brain correlations were computed between participant‐level maps and DHEA levels (as a measure of maturation), to examine overall developmental changes in the neural responses unique to hormonal influence. When using hormone levels as a proxy for development, chronological age was used as a covariate of no‐interest in order to detect the unique effects of DHEA on neural oscillatory activity above and beyond the effects of age. To identify DHEA‐by‐sex interactions, whole‐brain correlation maps were computed separately between males and females. Fisher's r to Z transformation was then applied to these maps, which provided a voxel‐wise map of Z‐scores representing the normalized sex differences in the oscillatory coding of visuospatial processing. Follow‐up analyses were performed on all significant gamma response interactions to confirm the effects of DHEA‐by‐sex interactions on oscillatory activity above‐and‐beyond other potential age‐related effects. All maps were thresholded at p < .005 and corrected for multiple comparisons using a spatial extent threshold of eight contiguous (4 × 4 × 4 mm) voxels (i.e., 512 mm3) based on the theory of Gaussian random fields (Woo et al., 2014; Worsley et al., 1996).
To examine network‐level effects, a similar statistical approach was used on the coherence maps. Briefly, whole‐brain coherence was computed using the peak voxels of significant clusters in the DHEA/oscillatory amplitude correlation maps as seeds. These coherence maps were then evaluated for correlations with DHEA while covarying out age. To limit the confound of source power on coherence, any region exhibiting significant associations was entered into a post hoc analysis, where the source amplitudes of the seed and target regions were covaried out to ensure that any significant effects detected were not the result of biases resulting from systematic power differences. For associations between DHEA and coherence values, age was also covaried out to detect unique hormonal effects on the development of network connectivity.
3. RESULTS
3.1. DHEA results
All participants exhibited DHEA levels within the inclusion range (i.e., no outliers). As expected, chronological age was positively correlated with DHEA levels in the whole sample (r = .40, p = .02; Figure 2), such that older children possessed higher levels of DHEA. There were no significant sex differences in age or DHEA levels.
FIGURE 2.
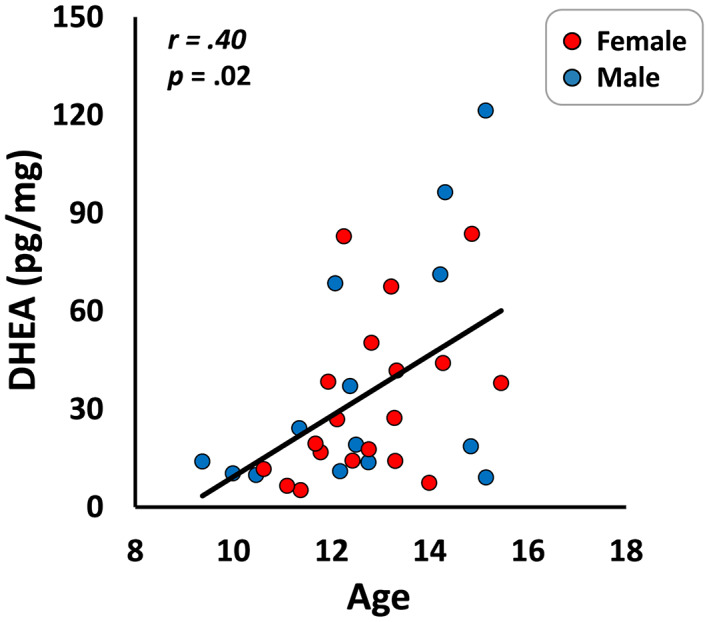
A significant positive correlation between DHEA and age for the whole sample. Male (blue) and female (red) data have been plotted separately only to enhance clarity; this correlation did not significantly differ between the sexes
3.2. Demographic data and behavioral results
Of the 35 participants who completed the task, two were excluded due to excessively noisy MEG data; therefore the final sample consisted of 33 children and adolescents (M age = 12.82 years, SD = 1.57; 19 F). Participants performed well on the visuospatial processing task. Average accuracy on the task was 94.24% ± 6.50% and the average reaction time was 573.1 ± 100.6 ms. There were no significant associations between DHEA and reaction time or accuracy; further, there was no significant relationship between reaction time and accuracy (i.e., no speed accuracy tradeoff). Thus, participants across all developmental stages performed similarly on this basic visuospatial task. There were also no sex differences in performance on the task.
3.3. Neural oscillatory responses to the task
Statistical evaluation of the time‐frequency spectrograms revealed five significant clusters of oscillatory activity (Figure 3, all p's < .001 after cluster‐based permutation testing). Significant synchronizations, or increases in power relative to baseline, were observed in the theta band (3–7 Hz) from stimulus onset to 350 ms, and in the high gamma range during an early (75–175 ms and 74–88 Hz) and later (325–500 ms, 64–80 Hz) window in occipital sensors. Additionally, a significant decrease in power, or desynchronization, was observed in the alpha band (8–14 Hz) from 350 to 500 ms in posterior sensors, and in the beta band (350–625 ms and 18–24 Hz) near the sensorimotor cortices. Spectrograms with the phase‐locked component removed are provided in the Supporting Information (Figure S1). The neural populations generating each of these responses were then imaged using a beamformer, and the resulting grand‐averaged maps were averaged per oscillatory response. These maps revealed that theta and both early and late gamma responses were strongest in the medial occipital cortices, while the alpha response was centered more laterally in bilateral occipital regions. Beta activity was centered on the contralateral primary motor cortex, and thus indicative of the motor response (i.e., button press) rather than perceptual or attention processing. Given our study focused on visuospatial processing, this beta response was not further examined.
FIGURE 3.
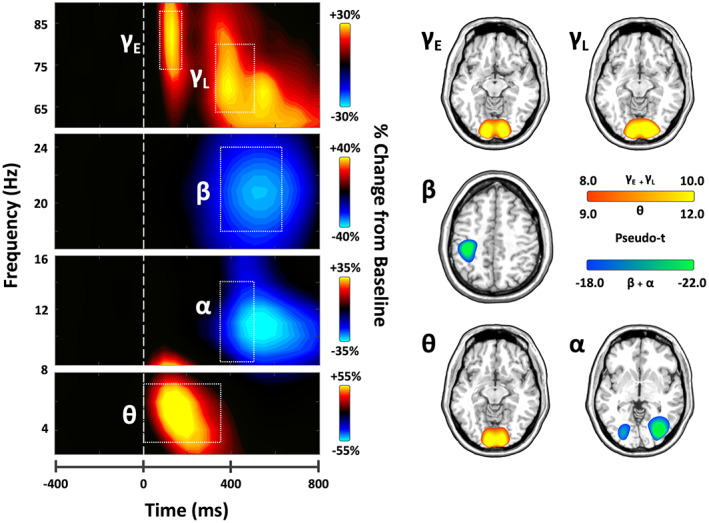
(Left) Time‐frequency spectrograms of significant oscillatory responses during the task. Data are from two occipital sensors (gamma: M2043, alpha/theta: M1922) and one sensor near the left parietal cortex (Beta: M0443) and have been averaged across all participants. Note that spectrograms with the phase‐locked component removed (i.e., induced activity only) are provided in the supplement (Figure S1). Warm colors reflect power increases relative to the baseline, and cool colors represent decreases relative to baseline. Time frequency windows for source imaging (beamforming) were derived from statistical analyses of these sensor‐level spectrograms, which indicated significant bins in theta, alpha, beta, and gamma activity. (Right) Group‐averaged beamformer images of each time‐frequency oscillatory bin of interest across all participants. The theta, alpha, and two gamma oscillatory responses originated in bilateral occipital cortices, whereas beta was centered on the motor cortex and thus not further examined. Color scale bars indicate the strength of responses (pseudo‐t). Warm colors indicate synchronizations; cool colors indicate desynchronizations
3.4. DHEA effects on oscillatory activity
Effects of pubertal development on neural oscillatory responses were examined by correlating each participant's functional maps with DHEA levels. These analyses used DHEA levels as a covariate of interest and chronological age as a covariate of no‐interest in order to isolate the unique pubertal effects from general age‐related developmental trends. When controlling for age, these whole‐brain correlation maps revealed that theta activity in the right dorsolateral prefrontal cortex (DLPFC) was negatively correlated with endogenous DHEA levels (r = −.497, p = .004; Figure 4a). Follow‐up analyses using intertrial phase coherence indicated that this theta response had both induced and phase‐locked components, with the induced component comprising a larger portion of the signal (Figure S2). The opposite pattern was observed in early gamma activity in left parietal regions, where the gamma response strengthened with greater DHEA levels (r = .514, p = .003). There were no significant correlations between DHEA and the alpha or late gamma oscillatory responses.
FIGURE 4.
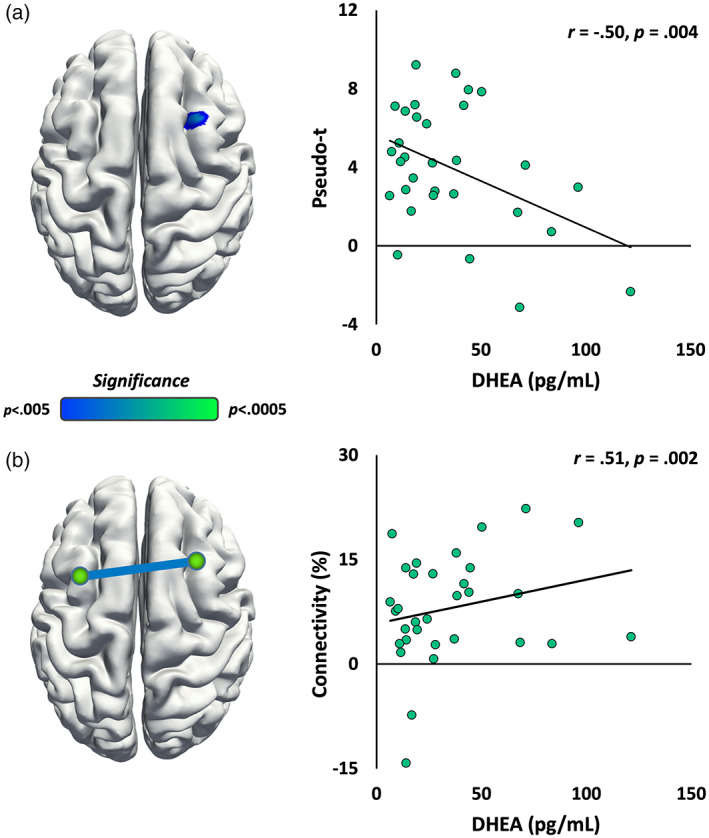
Correlations between DHEA levels and theta band activity. (a, Left) Whole‐brain correlations showed a negative relationship between DHEA and theta band activity in the right dorsolateral prefrontal cortex, whereby children with higher DHEA levels (i.e., more mature) exhibited less theta activity in this higher‐order, prefrontal region. Brain images are displayed following neurological convention. Color scale bar indicates statistical significance. (Right) Scatterplot shows the correlation between DHEA and theta activity in the peak voxel (age corrected) extracted from the corresponding map to the left. (b, Left) Connectivity analyses revealed increasing theta coherence between two bilateral prefrontal nodes with increasing DHEA levels (i.e., more maturity). (Right) Scatterplot shows increased theta coherence between the bilateral prefrontal regions (age/amplitude corrected) as a function of DHEA. Thus, these data indicate network‐level theta activity increases with increasing DHEA
To examine whether network connectivity with these peaks varied as a function of DHEA levels, whole‐brain coherence maps were computed using the peak voxels from these DHEA correlation maps as the seed (e.g., right DLPFC), and then correlating the resultant coherence values with DHEA levels. In theta activity, coherence between right and left prefrontal regions increased as a function of DHEA (r = .516, p = .002; Figure 4b), whereby children with higher endogenous DHEA exhibited more network‐level coherence. In other words, this increase in coherence indicated that network‐level theta activity between the bilateral prefrontal cortices was becoming systematically stronger with increasing DHEA. Of note, this pattern is the opposite of what would be expected if the connectivity differences were being driven by changes in theta source power.
3.5. DHEA by sex interactions in neural oscillatory activity
Finally, to identify whether developmental changes in oscillatory activity varied by sex, we computed Fisher's r to Z transformations to compare DHEA‐wise correlation maps between males and females. Sex‐specific developmental effects were observed in the late gamma band in three brain regions. Males showed stronger gamma activity with increasing DHEA in the right inferior frontal cortex (Z = 3.65, p < .001; Figure 5), left inferior frontal cortex (Z = 3.14, p = .001), and the left temporal cortex (Z = 3.04, p = .002). Follow‐up hierarchical regression analyses showed that these DHEA‐by‐sex interactions were significant predictors of gamma oscillatory activity above and beyond the other control variables, including age and the age‐by‐sex interaction (Table S1). No significant sex‐by‐DHEA interactions were observed in the theta, alpha, or early gamma responses.
FIGURE 5.
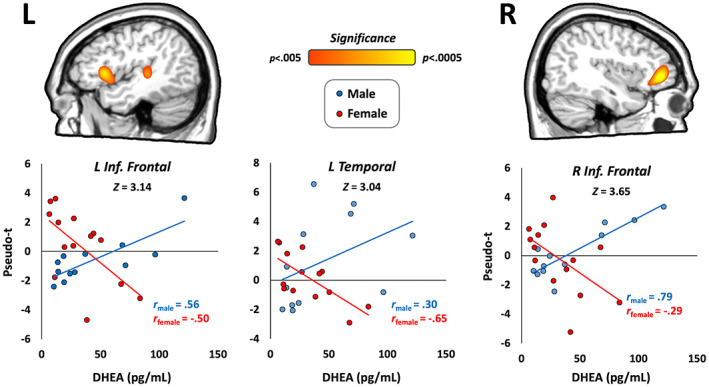
DHEA‐by‐sex interactions in the gamma band. Fisher's r to Z maps showed significant sex differences across cortical regions involved in visuospatial processing. (Top) Males showed stronger associations between DHEA and gamma activity compared to females in all three regions, including the left inferior frontal gyrus, left temporal cortex, and right inferior frontal gyrus. Color scale bar indicates the significance of the DHEA‐by‐sex interaction effects. (Bottom) Scatterplots show correlations between DHEA (corrected for age) and gamma activity in peak voxels extracted from the corresponding map above, which differed between males and females
4. DISCUSSION
In this study, we examined the developmental trajectory of neural oscillatory activity serving visuospatial processing in relation to pubertal DHEA levels in typically developing youth. We observed robust increases in power relative to the baseline (i.e., neural synchronizations) in the theta (3–7 Hz) and high gamma bands (64–80 and 74–88 Hz), and decreases in power (i.e., desynchronizations) in the alpha (8–14 Hz) and beta frequency bands. All responses of interest originated in the occipital cortices, with the motor related beta response emerging from the sensorimotor strip. These average responses corroborate prior MEG studies investigating oscillatory activity serving visuospatial processing in youth (Fung et al., 2020; Killanin et al., 2020) and adult populations (Lew et al., 2020; Wiesman et al., 2017, 2018; Wiesman & Wilson, 2019), including those that utilized the same visuospatial processing task. Our key findings were the novel associations between DHEA levels and neural oscillatory responses, which also differed by sex, which likely reflect maturational effects on neural networks during puberty.
One of our most interesting findings was the negative association between DHEA and theta oscillatory activity within the right DLPFC. The prefrontal cortex exhibits protracted structural development extending throughout adolescence (Giedd, 2004; Gogtay et al., 2004; Vijayakumar et al., 2018), and robust activity in the DLPFC and neighboring prefrontal regions has been widely implicated in cognitive control and higher‐order processing in adults (MacDonald et al., 2000; Miller, 2000). Pediatric neuroimaging studies have additionally shown that activity decreases in task‐irrelevant regions with further development, specifically implicating an attenuation in DLPFC activity in some cognitive control tasks (Casey et al., 1997; Durston et al., 2006). Thus, the present results of decreasing DLPFC activity with increasing DHEA may be indicative of more automatic, mature neural processing, whereby less higher‐order prefrontal engagement was needed to complete the simple visuospatial processing task. Additionally, the developmental changes in connectivity between bilateral prefrontal regions observed in the current study may suggest neural efficiency is improving at the network‐scale, as functional networks shift from local to a more distributed organization over the course of development (Fair et al., 2009). We saw increased theta coherence between the bilateral prefrontal regions as a function of DHEA, indicating that network‐level prefrontal theta activity systematically increased during task performance with further development. These results further suggest that patterns of functional neural development occur at both the local and network levels for theta oscillatory activity. Thus, both of these findings are indicative of an increasingly mature prefrontal cortex response during the top‐down control of basic visuospatial processing.
Additionally, DHEA‐by‐sex interactions were observed in the gamma range during task performance, whereby males showed strong positive correlations between DHEA levels and gamma oscillatory power, while females demonstrated the opposite pattern. These interactions were found in several cortical regions, including the inferior frontal gyrus, a key node in the ventral attention network (Corbetta & Shulman, 2002; Corbetta et al., 2008), which may suggest differential network development and/or processing strategies between the sexes for detecting behaviorally relevant visual stimuli during puberty. These results also corroborate previous findings of the involvement of gamma oscillations in visual attention allocation and processing activity (Jensen et al., 2007). The significant sex‐by‐DHEA interactions were only found within the gamma band, which is noteworthy as gamma oscillatory activity is widely associated with GABA‐mediated local inhibitory networks that also continue to develop throughout adolescence and early adulthood (Bartos et al., 2007; Buzsáki & Wang, 2012; Edden et al., 2009; Fries et al., 2007; Hashimoto et al., 2009; Kilb, 2012; Muthukumaraswamy et al., 2009). These findings may suggest that the sex‐specific influence of pubertal hormones is limited to high‐frequency neural responses during this developmental period, as thus far sexually dimorphic patterns of oscillatory development have only been observed in the gamma band (Fung et al., 2020); however, future studies probing additional cognitive constructs, indices of development, and developmental windows are required to substantiate this view.
Although the emergence of DHEA secretion in adrenarche occurs in early childhood, the effects of this hormone are not limited to the prepubertal period. DHEA increases to its highest concentrations in early adulthood; thus, the developmental function of this steroid presumably extends well beyond the pubertal transition (Campbell, 2006; Maninger et al., 2009; Nguyen, 2017). In fact, the active window for DHEA closely aligns with the general trajectory of cortical maturation in youth, in which key functional transitions occur in both childhood and early adulthood, suggesting a tight link between these developmental processes (Campbell, 2006; Herting & Sowell, 2017). Specifically, the prefrontal cortex, responsible for processing higher‐order and executive functions, matures much later in adolescence than more basic sensory areas (Casey et al., 2005; Gogtay et al., 2004). Social, emotional, and cognitive functions that rely on prefrontal activity, such as attention, dramatically change throughout adolescence, instigating substantial behavioral maturation concomitant with these hormonal changes in puberty (Blakemore, 2012; Luna et al., 2004; Rubia, 2013; Schulte et al., 2020). Further, endogenous levels of DHEA and its sulfate are associated with cognitive performance later in adulthood (de Menezes et al., 2016; Racchi et al., 2003). Thus, since adrenarche is defined as the gradual maturation of adrenal gland functions rather than a single discrete event (Palmert et al., 2001), the present study likely captured outcomes of the continuous DHEA increases during the pubertal transition, which can specifically impact functional brain development of cognitive processes and their behavioral outcomes.
It is important to address limitations associated with the present study before closing. First, hormonal measures were assessed through salivary assays. While less invasive, and therefore more suitable for developmental studies, saliva samples are less sensitive to low hormone concentrations compared to invasive blood sample measures (Herting & Sowell, 2017). Additionally, baseline hormone concentrations inherently fluctuate between individuals on the bases of sex, time of day, and other situational factors (Herting & Sowell, 2017; Matchock et al., 2007). These fluctuations were accounted for to some degree by collecting samples at similar times, and it is worth noting that sample concentrations did not differ by sex in the present study. However, future work using alternative assay methods, such as hair hormone concentrations, could obtain a more representative, average level of physiologically active pubertal hormones (Short et al., 2016). Future studies should also investigate the net impact of other sex hormones on the development of other functional domains and attentional manipulations, as many cognitive processes that mature during adolescence are likely also influenced by pubertal hormones. We focused on DHEA in the current study, but assessing multiple pubertal hormones simultaneously could lead to major new insights and should be a priority for future work. Additionally, given the narrow age range and modest sample size in the present study, future work incorporating additional participants outside of the 9–15 year‐old range could produce a more complete picture of development. Including additional metrics of pubertal staging could also help further inform the nature of cognitive maturation during different periods of pubertal development.
5. CONCLUSION
To conclude, the present study found novel associations between DHEA and the neural oscillatory dynamics serving visuospatial processing in typically developing children. Pubertal DHEA was significantly associated with theta oscillatory activity, such that more mature children exhibited weaker theta oscillations in local prefrontal circuits and stronger longer‐range connectivity among bilateral prefrontal networks during visuospatial task performance. Additionally, significant sex‐specific interactions with DHEA were observed in the gamma range, which originated in regions important for visual attention processing. Across multiple regions, we found that males showed positive correlations between DHEA levels and gamma oscillatory power, while females showed the opposite trend. This suggests that sex‐specific developmental trajectories unfold over the course of puberty and are modulated at least in part by DHEA. To close, the current study identified novel developmental effects associated with DHEA that were unique from other axes of pubertal maturation, and these corroborate previous findings of protracted functional brain development that continues throughout the course of pubertal development.
AUTHOR CONTRIBUTIONS
Madison H. Fung: Conceptualization, formal analysis, writing – original draft, writing – review and editing, visualization. Raeef L. Rahman: Conceptualization, formal analysis, writing – original draft, writing – review and editing, visualization. Brittany K. Taylor: Conceptualization, writing – review and editing, supervision. Michaela R. Frenzel: Investigation, project administration; Jacob A. Eastman: Investigation; Yu‐Ping Wang: Writing – review and editing, funding acquisition. Vince D. Calhoun: Writing – review and editing, funding acquisition. Julia M. Stephen: Writing – review and editing, funding acquisition. Tony W. Wilson: Conceptualization, Methodology, writing – review and editing, supervision, funding acquisition.
CONFLICT OF INTEREST
All authors report no financial interests or conflicts of interest.
ETHICS STATEMENT
All procedures were approved by the Institutional Review Board, and informed consent from the child's parent or legal guardian, as well as assent from the child, were obtained electronically before proceeding with the study.
Supporting information
Appendix S1 Supporting information
ACKNOWLEDGEMENTS
This research was supported by grants R01‐MH121101 (TWW), R01‐MH116782 (TWW), R01‐MH118013 (TWW), P20‐GM144641 (TWW), and R01‐EB020407 (VDC) from the National Institutes of Health, and grant #1539067 from the National Science Foundation (TWW, VCD, Y‐PW, and JMS). The funders had no role in study design, data collection and analysis, decision to publish, or preparation of the manuscript. All salivary assays and analyses were performed at the University of Nebraska–Lincoln Salivary Bioscience Laboratory. The authors thank Dr. Jessica L. Calvi for her insight and assistance with this aspect of the study.
Fung, M. H. , Rahman, R. L. , Taylor, B. K. , Frenzel, M. R. , Eastman, J. A. , Wang, Y.‐P. , Calhoun, V. D. , Stephen, J. M. , & Wilson, T. W. (2022). The impact of pubertal DHEA on the development of visuospatial oscillatory dynamics. Human Brain Mapping, 43(17), 5154–5166. 10.1002/hbm.25991
Madison H. Fung and Raeef L. Rahman contributed equally to this study.
Funding information National Institutes of Health, Grant/Award Numbers: P20‐GM144641, R01‐EB020407, R01‐MH116782, R01‐MH118013, R01‐MH121101; National Science Foundation, Grant/Award Number: 1539067
DATA AVAILABILITY STATEMENT
All data that support the findings of this study are available upon reasonable request to the corresponding author (TWW). Data will be made publicly available upon study completion.
REFERENCES
- Ahmed, E. I. , Zehr, J. L. , Schulz, K. M. , Lorenz, B. H. , DonCarlos, L. L. , & Sisk, C. L. (2008). Pubertal hormones modulate the addition of new cells to sexually dimorphic brain regions. Nature Neuroscience, 11(9), 995–997. 10.1038/nn.2178 [DOI] [PMC free article] [PubMed] [Google Scholar]
- Bartos, M. , Vida, I. , & Jonas, P. (2007). Synaptic mechanisms of synchronized gamma oscillations in inhibitory interneuron networks. Nature Reviews. Neuroscience, 8(1), 45–56. 10.1038/nrn2044 [DOI] [PubMed] [Google Scholar]
- Blakemore, S. J. (2012). Development of the social brain in adolescence. Journal of the Royal Society of Medicine, 105(3), 111–116. 10.1258/jrsm.2011.110221 [DOI] [PMC free article] [PubMed] [Google Scholar]
- Blakemore, S. J. , Burnett, S. , & Dahl, R. E. (2010). The role of puberty in the developing adolescent brain. Human Brain Mapping, 31(6), 926–933. 10.1002/hbm.21052 [DOI] [PMC free article] [PubMed] [Google Scholar]
- Bramen, J. E. , Hranilovich, J. A. , Dahl, R. E. , Chen, J. , Rosso, C. , Forbes, E. E. , Dinov, I. D. , Worthman, C. M. , & Sowell, E. R. (2012). Sex matters during adolescence: Testosterone‐related cortical thickness maturation differs between boys and girls. PLoS One, 7(3), e33850. 10.1371/journal.pone.0033850 [DOI] [PMC free article] [PubMed] [Google Scholar]
- Buzsáki, G. , & Wang, X. J. (2012). Mechanisms of gamma oscillations. Annual Review of Neuroscience, 35, 203–225. 10.1146/annurev-neuro-062111-150444 [DOI] [PMC free article] [PubMed] [Google Scholar]
- Byrne, M. L. , Whittle, S. , Vijayakumar, N. , Dennison, M. , Simmons, J. G. , & Allen, N. B. (2017). A systematic review of adrenarche as a sensitive period in neurobiological development and mental health. Developmental Cognitive Neuroscience, 25, 12–28. 10.1016/j.dcn.2016.12.004 [DOI] [PMC free article] [PubMed] [Google Scholar]
- Campbell, B. (2006). Adrenarche and the evolution of human life history. American Journal of Human Biology, 18(5), 569–589. 10.1002/ajhb.20528 [DOI] [PubMed] [Google Scholar]
- Casey, B. J. , Tottenham, N. , Liston, C. , & Durston, S. (2005). Imaging the developing brain: What have we learned about cognitive development? Trends in Cognitive Sciences, 9(3), 104–110. 10.1016/j.tics.2005.01.011 [DOI] [PubMed] [Google Scholar]
- Casey, B. J. , Trainor, R. J. , Orendi, J. L. , Schubert, A. B. , Nystrom, L. E. , Giedd, J. N. , Giedd, J. N. , Castellanos, F. X. , Haxby, J. V. , Noll, D. C. , Cohen, J. D. , Forman, S. D. , Dahl, R. E. , & Rapoport, J. L. (1997). A developmental functional MRI study of prefrontal activation during performance of a go‐no‐go task. Journal of Cognitive Neuroscience, 9(6), 835–847. 10.1162/jocn.1997.9.6.835 [DOI] [PubMed] [Google Scholar]
- Corbetta, M., & Shulman, G. L. (2002). Control of goal‐directed and stimulus‐driven attention in the brain. Nature Reviews Neuroscience, 3, 201–215. doi: 10.1038/nrn755. [DOI] [PubMed]
- Corbetta, M., Patel, G., & Shulman, G. L. (2008). The reorienting system of the human brain: from environment to theory of mind. Neuron, 58, 306–324. doi: 10.1016/j.neuron.2008.04.017. [DOI] [PMC free article] [PubMed]
- Corpéchot, C. , Robel, P. , Axelson, M. , Sjövall, J. , & Baulieu, E. E. (1981). Characterization and measurement of dehydroepiandrosterone sulfate in rat brain. Proceedings of the National Academy of Sciences of the United States of America, 78(8), 4704–4707. 10.1073/pnas.78.8.4704 [DOI] [PMC free article] [PubMed] [Google Scholar]
- Cservenka, A. , Stroup, M. L. , Etkin, A. , & Nagel, B. J. (2015). The effects of age, sex, and hormones on emotional conflict‐related brain response during adolescence. Brain and Cognition, 99, 135–150. 10.1016/j.bandc.2015.06.002 [DOI] [PMC free article] [PubMed] [Google Scholar]
- Davis, E. C. , Popper, P. , & Gorski, R. A. (1996). The role of apoptosis in sexual differentiation of the rat sexually dimorphic nucleus of the preoptic area. Brain Research, 734(1–2), 10–18. 10.1016/0006-8993(96)00298-3 [DOI] [PubMed] [Google Scholar]
- De Bellis, M. D. , Keshavan, M. S. , Beers, S. R. , Hall, J. , Frustaci, K. , Masalehdan, A. , Noll, J. , & Boring, A. M. (2001). Sex differences in brain maturation during childhood and adolescence. Cerebral Cortex, 11(6), 552–557. 10.1093/cercor/11.6.552 [DOI] [PubMed] [Google Scholar]
- de Menezes, K. J. , Peixoto, C. , Nardi, A. E. , Carta, M. G. , Machado, S. , & Veras, A. B. (2016). Dehydroepiandrosterone, its sulfate and cognitive functions. Clinical Practice and Epidemiology in Mental Health, 12, 24–37. 10.2174/1745017901612010024 [DOI] [PMC free article] [PubMed] [Google Scholar]
- Durston, S. , Davidson, M. C. , Tottenham, N. , Galvan, A. , Spicer, J. , Fossella, J. A. , & Casey, B. J. (2006). A shift from diffuse to focal cortical activity with development. Developmental Science, 9(1), 1–8. 10.1111/j.1467-7687.2005.00454.x [DOI] [PubMed] [Google Scholar]
- Edden, R. A. , Muthukumaraswamy, S. D. , Freeman, T. C. , & Singh, K. D. (2009). Orientation discrimination performance is predicted by GABA concentration and gamma oscillation frequency in human primary visual cortex. The Journal of Neuroscience, 29(50), 15721–15726. 10.1523/JNEUROSCI.4426-09.2009 [DOI] [PMC free article] [PubMed] [Google Scholar]
- Embury, C. M. , Wiesman, A. I. , Proskovec, A. L. , Mills, M. S. , Heinrichs‐Graham, E. , Wang, Y. P. , Calhoun, V. D. , Stephen, J. M. , & Wilson, T. W. (2019). Neural dynamics of verbal working memory processing in children and adolescents. NeuroImage, 185, 191–197. 10.1016/j.neuroimage.2018.10.038 [DOI] [PMC free article] [PubMed] [Google Scholar]
- Ernst, M. D. (2004). Permutation methods: A basis for exact inference. Statistical Science, 19, 676–685. [Google Scholar]
- Fair, D. A. , Cohen, A. L. , Power, J. D. , Dosenbach, N. U. , Church, J. A. , Miezin, F. M. , Schlaggar, B. L. , & Petersen, S. E. (2009). Functional brain networks develop from a "local to distributed" organization. PLoS Computational Biology, 5, e1000381. 10.1371/journal.pcbi.1000381 [DOI] [PMC free article] [PubMed] [Google Scholar]
- Fries, P. , Nikolić, D. , & Singer, W. (2007). The gamma cycle. Trends in Neurosciences, 30(7), 309–316. 10.1016/j.tins.2007.05.005 [DOI] [PubMed] [Google Scholar]
- Fung, M. H. , Taylor, B. K. , Frenzel, M. R. , Eastman, J. A. , Wang, Y. P. , Calhoun, V. D. , Stephen, J. M. , & Wilson, T. W. (2020). Pubertal testosterone tracks the developmental trajectory of neural oscillatory activity serving visuospatial processing. Cerebral Cortex, 30(11), 5960–5971. 10.1093/cercor/bhaa169 [DOI] [PMC free article] [PubMed] [Google Scholar]
- Giedd, J. N. , Blumenthal, J. , Jeffries, N. O. , Castellanos, F. X. , Liu, H. , Zijdenbos, A. , Paus, T. , Evans, A. C. , & Rapoport, J. L. (1999). Brain development during childhood and adolescence: A longitudinal MRI study. Nature Neuroscience, 2(10), 861–863. 10.1038/13158 [DOI] [PubMed] [Google Scholar]
- Giedd, J. N. (2004). Structural magnetic resonance imaging of the adolescent brain. Annals of the New York Academy of Sciences, 1021, 77–85. doi: 10.1196/annals.1308.009. [DOI] [PubMed]
- Goddings, A. L. , Beltz, A. , Peper, J. S. , Crone, E. A. , & Braams, B. R. (2019). Understanding the role of puberty in structural and functional development of the adolescent brain. Journal of Research on Adolescence, 29(1), 32–53. 10.1111/jora.12408 [DOI] [PubMed] [Google Scholar]
- Gogtay, N. , Giedd, J. N. , Lusk, L. , Hayashi, K. M. , Greenstein, D. , Vaituzis, A. C. , Nugent, T. F., III , Herman, D. H. , Clasen, L. S. , Toga, A. W. , Rapoport, J. L. , & Thompson, P. M. (2004). Dynamic mapping of human cortical development during childhood through early adulthood. Proceedings of the National Academy of Sciences of the United States of America, 101(21), 8174–8179. 10.1073/pnas.0402680101 [DOI] [PMC free article] [PubMed] [Google Scholar]
- Gross, J. , Kujala, J. , Hamalainen, M. , Timmermann, L. , Schnitzler, A. , & Salmelin, R. (2001). Dynamic imaging of coherent sources: Studying neural interactions in the human brain. Proceedings of the National Academy of Sciences of the United States of America, 98(2), 694–699. 10.1073/pnas.98.2.694 [DOI] [PMC free article] [PubMed] [Google Scholar]
- Hashimoto, T. , Nguyen, Q. L. , Rotaru, D. , Keenan, T. , Arion, D. , Beneyto, M. , Gonzalez‐Burgos, G. , & Lewis, D. A. (2009). Protracted developmental trajectories of GABAA receptor alpha1 and alpha2 subunit expression in primate prefrontal cortex. Biological Psychiatry, 65(12), 1015–1023. 10.1016/j.biopsych.2009.01.004 [DOI] [PMC free article] [PubMed] [Google Scholar]
- Heinrichs‐Graham, E. , McDermott, T. J. , Mills, M. S. , Wiesman, A. I. , Wang, Y. P. , Stephen, J. M. , Calhoun, V. D. , & Wilson, T. W. (2018). The lifespan trajectory of neural oscillatory activity in the motor system. Developmental Cognitive Neuroscience, 30, 159–168. 10.1016/j.dcn.2018.02.013 [DOI] [PMC free article] [PubMed] [Google Scholar]
- Heinrichs‐Graham, E. , Taylor, B. K. , Wang, Y. P. , Stephen, J. M. , Calhoun, V. D. , & Wilson, T. W. (2020). Parietal oscillatory dynamics mediate developmental improvement in motor performance. Cerebral Cortex, 30(12), 6405–6414. 10.1093/cercor/bhaa199 [DOI] [PMC free article] [PubMed] [Google Scholar]
- Herting, M. M. , & Sowell, E. R. (2017). Puberty and structural brain development in humans. Frontiers in Neuroendocrinology, 44, 122–137. 10.1016/j.yfrne.2016.12.003 [DOI] [PMC free article] [PubMed] [Google Scholar]
- Hillebrand, A. , Singh, K. D. , Holliday, I. E. , Furlong, P. L. , & Barnes, G. R. (2005). A new approach to neuroimaging with magnetoencephalography. Human Brain Mapping, 25(2), 199–211. 10.1002/hbm.20102 [DOI] [PMC free article] [PubMed] [Google Scholar]
- Jensen, O. , Kaiser, J. , & Lachaux, J. P. (2007). Human gamma‐frequency oscillations associated with attention and memory. Trends in Neurosciences, 30(7), 317–324. 10.1016/j.tins.2007.05.001 [DOI] [PubMed] [Google Scholar]
- Kilb, W. (2012). Development of the GABAergic system from birth to adolescence. The Neuroscientist, 18(6), 613–630. 10.1177/1073858411422114 [DOI] [PubMed] [Google Scholar]
- Killanin, A. D. , Wiesman, A. I. , Heinrichs‐Graham, E. , Groff, B. R. , Frenzel, M. R. , Eastman, J. A. , Wang, Y.‐P. , Calhoun, V. D. , Stephen, J. M. , & Wilson, T. W. (2020). Development and sex modulate visuospatial oscillatory dynamics in typically‐developing children and adolescents. NeuroImage, 221, 117192. 10.1016/j.neuroimage.2020.117192 [DOI] [PMC free article] [PubMed] [Google Scholar]
- Koolschijn, P. C. , Peper, J. S. , & Crone, E. A. (2014). The influence of sex steroids on structural brain maturation in adolescence. PLoS One, 9(1), e83929. 10.1371/journal.pone.0083929 [DOI] [PMC free article] [PubMed] [Google Scholar]
- Kovach, C. K. , & Gander, P. E. (2016). The demodulated band transform. Journal of Neuroscience Methods, 261, 135–154. 10.1016/j.jneumeth.2015.12.004 [DOI] [PMC free article] [PubMed] [Google Scholar]
- Lew, B. J. , Wiesman, A. I. , Rezich, M. T. , & Wilson, T. W. (2020). Altered neural dynamics in occipital cortices serving visual‐spatial processing in heavy alcohol users. Journal of Psychopharmacology, 34(2), 245–243. 10.1177/0269881119863120 [DOI] [PMC free article] [PubMed] [Google Scholar]
- Luna, B. , Garver, K. E. , Urban, T. A. , Lazar, N. A. , & Sweeney, J. A. (2004). Maturation of cognitive processes from late childhood to adulthood. Child Development, 75(5), 1357–1372. 10.1111/j.1467-8624.2004.00745.x [DOI] [PubMed] [Google Scholar]
- MacDonald, A. W. , Cohen, J. D. , Stenger, V. A. , & Carter, C. S. (2000). Dissociating the role of the dorsolateral prefrontal and anterior cingulate cortex in cognitive control. Science, 288(5472), 1835–1838. 10.1126/science.288.5472.1835 [DOI] [PubMed] [Google Scholar]
- Maninger, N. , Wolkowitz, O. M. , Reus, V. I. , Epel, E. S. , & Mellon, S. H. (2009). Neurobiological and neuropsychiatric effects of dehydroepiandrosterone (DHEA) and DHEA sulfate (DHEAS). Frontiers in Neuroendocrinology, 30(1), 65–91. 10.1016/j.yfrne.2008.11.002 [DOI] [PMC free article] [PubMed] [Google Scholar]
- Maris, E. , & Oostenveld, R. (2007). Nonparametric statistical testing of EEG‐ and MEG‐data. Journal of Neuroscience Methods, 164(1), 177–190. 10.1016/j.jneumeth.2007.03.024 [DOI] [PubMed] [Google Scholar]
- Matchock, R. L. , Dorn, L. D. , & Susman, E. J. (2007). Diurnal and seasonal cortisol, testosterone, and DHEA rhythms in boys and girls during puberty. Chronobiology International, 24(5), 969–990. 10.1080/07420520701649471 [DOI] [PubMed] [Google Scholar]
- Miller, E. K. (2000). The prefrontal cortex and cognitive control. Nature Reviews. Neuroscience, 1(1), 59–65. 10.1038/35036228 [DOI] [PubMed] [Google Scholar]
- Muthukumaraswamy, S. D. , Edden, R. A. , Jones, D. K. , Swettenham, J. B. , & Singh, K. D. (2009). Resting GABA concentration predicts peak gamma frequency and fMRI amplitude in response to visual stimulation in humans. Proceedings of the National Academy of Sciences of the United States of America, 106(20), 8356–8361. 10.1073/pnas.0900728106 [DOI] [PMC free article] [PubMed] [Google Scholar]
- Neufang, S. , Specht, K. , Hausmann, M. , Güntürkün, O. , Herpertz‐Dahlmann, B. , Fink, G. R. , & Konrad, K. (2009). Sex differences and the impact of steroid hormones on the developing human brain. Cerebral Cortex, 19(2), 464–473. 10.1093/cercor/bhn100 [DOI] [PubMed] [Google Scholar]
- Neunzig, J. , & Bernhardt, R. (2014). Dehydroepiandrosterone sulfate (DHEAS) stimulates the first step in the biosynthesis of steroid hormones. PLoS One, 9(2), e89727. 10.1371/journal.pone.0089727 [DOI] [PMC free article] [PubMed] [Google Scholar]
- Nguyen, T. V. (2017). Developmental effects of androgens in the human brain. Journal of Neuroendocrinology, 30(2), 1–13. [DOI] [PubMed] [Google Scholar]
- Nguyen, T. V. , McCracken, J. , Ducharme, S. , Botteron, K. N. , Mahabir, M. , Johnson, W. , Israel, M. , Evans, A. C. , Karama, S. , & Brain Development Cooperative Group . (2013). Testosterone‐related cortical maturation across childhood and adolescence. Cerebral Cortex, 23(6), 1424–1432. 10.1093/cercor/bhs125 [DOI] [PMC free article] [PubMed] [Google Scholar]
- Nuñez, J. L. , Sodhi, J. , & Juraska, J. M. (2002). Ovarian hormones after postnatal day 20 reduce neuron number in the rat primary visual cortex. Journal of Neurobiology, 52(4), 312–321. 10.1002/neu.10092 [DOI] [PubMed] [Google Scholar]
- Palmert, M. R. , Hayden, D. L. , Mansfield, M. J. , Crigler, J. F. , Crowley, W. F. , Chandler, D. W. , & Boepple, P. A. (2001). The longitudinal study of adrenal maturation during gonadal suppression: evidence that adrenarche is a gradual process. The Journal of Clinical Endocrinology and Metabolism, 86(9), 4536–4542. 10.1210/jcem.86.9.7863 [DOI] [PubMed] [Google Scholar]
- Papp, N. , & Ktonas, P. (1977). Critical evaluation of complex demodulation techniques for the quantification of bioelectrical activity. Biomedical Sciences Instrumentation, 13, 135–145. [PubMed] [Google Scholar]
- Paus, T. , Nawaz‐Khan, I. , Leonard, G. , Perron, M. , Pike, G. B. , Pitiot, A. , Richer, L. , Susman, E. , Veillette, S. , & Pausova, Z. (2010). Sexual dimorphism in the adolescent brain: role of testosterone and androgen receptor in global and local volumes of grey and white matter. Hormones and Behavior, 57(1), 63–75. 10.1016/j.yhbeh.2009.08.004 [DOI] [PubMed] [Google Scholar]
- Peper, J. S. , Brouwer, R. M. , Schnack, H. G. , van Baal, G. C. , van Leeuwen, M. , van den Berg, S. M. , Delemarre‐Van de Waal, H. A. , Boomsma, D. I. , Kahn, R. S. , & Hulshoff Pol, H. E. (2009). Sex steroids and brain structure in pubertal boys and girls. Psychoneuroendocrinology, 34(3), 332–342. 10.1016/j.psyneuen.2008.09.012 [DOI] [PubMed] [Google Scholar]
- Petersen, S. E. , & Posner, M. I. (2012). The attention system of the human brain: 20 years after. Annual Review of Neuroscience, 35, 73–89. 10.1146/annurev-neuro-062111-150525 [DOI] [PMC free article] [PubMed] [Google Scholar]
- Posner, M. I. , & Petersen, S. E. (1990). The attention system of the human brain. Annual Review of Neuroscience, 13, 25–42. 10.1146/annurev.ne.13.030190.000325 [DOI] [PubMed] [Google Scholar]
- Quinn, T. A. , Robinson, S. R. , & Walker, D. (2018). Dehydroepiandrosterone (DHEA) and DHEA sulfate: Roles in brain function and disease. In Drevensek G. (Ed.), Sex hormones in neurodegeneration processes and diseases (pp. 41–68). IntechOpen. [Google Scholar]
- Racchi, M. , Balduzzi, C. , & Corsini, E. (2003). Dehydroepiandrosterone (DHEA) and the aging brain: Flipping a coin in the "fountain of youth". CNS Drug Reviews, 9(1), 21–40. 10.1111/j.1527-3458.2003.tb00242.x [DOI] [PMC free article] [PubMed] [Google Scholar]
- Rehman, K. S. , & Carr, B. R. (2004). Sex differences in adrenal androgens. Seminars in Reproductive Medicine, 22(4), 349–360. 10.1055/s-2004-861551 [DOI] [PubMed] [Google Scholar]
- Root, A. W. (1973). Endocrinology of puberty: I. normal sexual maturation. The Journal of Pediatrics, 83, 1–19. doi: 10.1016/s0022-3476(73)80305-1. [DOI] [PubMed]
- Rubia, K. (2013). Functional brain imaging across development. European Child & Adolescent Psychiatry, 22(12), 719–731. 10.1007/s00787-012-0291-8 [DOI] [PMC free article] [PubMed] [Google Scholar]
- Rubia, K. , Hyde, Z. , Halari, R. , Giampietro, V. , & Smith, A. (2010). Effects of age and sex on developmental neural networks of visual‐spatial attention allocation. NeuroImage, 51(2), 817–827. 10.1016/j.neuroimage.2010.02.058 [DOI] [PubMed] [Google Scholar]
- Schulte, T. , Hong, J. Y. , Sullivan, E. V. , Pfefferbaum, A. , Baker, F. C. , Chu, W. , Prouty, D. , Kwon, D. , Meloy, M. J. , Brumback, T. , Tapert, S. F. , Colrain, I. M. , & Müller‐Oehring, E. M. (2020). Effects of age, sex, and puberty on neural efficiency of cognitive and motor control in adolescents. Brain Imaging and Behavior, 14(4), 1089–1107. 10.1007/s11682-019-00075-x [DOI] [PMC free article] [PubMed] [Google Scholar]
- Selmeczy, D. , Fandakova, Y. , Grimm, K. J. , Bunge, S. A. , & Ghetti, S. (2019). Longitudinal trajectories of hippocampal and prefrontal contributions to episodic retrieval: effects of age and puberty. Developmental Cognitive Neuroscience, 36, 100599. 10.1016/j.dcn.2018.10.003 [DOI] [PMC free article] [PubMed] [Google Scholar]
- Shirtcliff, E. A. , Dahl, R. E. , & Pollak, S. D. (2009). Pubertal development: Correspondence between hormonal and physical development. Child Development, 80(2), 327–337. 10.1111/j.1467-8624.2009.01263.x [DOI] [PMC free article] [PubMed] [Google Scholar]
- Short, S. J. , Stalder, T. , Marceau, K. , Entringer, S. , Moog, N. K. , Shirtcliff, E. A. , Wadhwa, P. D. , & Buss, C. (2016). Correspondence between hair cortisol concentrations and 30‐day integrated daily salivary and weekly urinary cortisol measures. Psychoneuroendocrinology, 71, 12–18. 10.1016/j.psyneuen.2016.05.007 [DOI] [PMC free article] [PubMed] [Google Scholar]
- Sisk, C. L. , & Foster, D. L. (2004). The neural basis of puberty and adolescence. Nature Neuroscience, 7(10), 1040–1047. 10.1038/nn1326 [DOI] [PubMed] [Google Scholar]
- Sowell, E. R., Thompson, P. M., Tessner, K. D., & Toga, A. W. (2001). Mapping continued brain growth and gray matter density reduction in dorsal frontal cortex: Inverse relationships during postadolescent brain maturation. The Journal of Neuroscience, 21, 8819–8829. doi: 10.1523/JNEUROSCI.21-22-08819.2001. [DOI] [PMC free article] [PubMed]
- Spooner, R. K. , Wiesman, A. I. , Proskovec, A. L. , Heinrichs‐Graham, E. , & Wilson, T. W. (2020). Prefrontal theta modulates sensorimotor gamma networks during the reorienting of attention. Human Brain Mapping, 41(2), 520–529. 10.1002/hbm.24819 [DOI] [PMC free article] [PubMed] [Google Scholar]
- Stephen, J. M. , Solis, I. , Janowich, J. , Stern, M. , Frenzel, M. R. , Eastman, J. A. , Mills, M. S. , Embury, C. M. , Coolidge, N. M. , Heinrichs‐Graham, E. , Mayer, A. , Liu, J. , Wang, Y. P. , Wilson, T. W. , & Calhoun, V. D. (2021). The developmental Chronnecto‐genomics (dev‐CoG) study: a multimodal study on the developing brain. NeuroImage, 225, 117438. 10.1016/j.neuroimage.2020.117438 [DOI] [PMC free article] [PubMed] [Google Scholar]
- Taulu, S. , Juha, S. , & Kajola, M. (2005). Applications of the signal space separation method. IEEE Transactions on Signal Processing, 53, 3359–3372. [Google Scholar]
- Taulu, S. , & Simola, J. (2006). Spatiotemporal signal space separation method for rejecting nearby interference in MEG measurements. Physics in Medicine and Biology, 51(7), 1759–1768. 10.1088/0031-9155/51/7/008 [DOI] [PubMed] [Google Scholar]
- Taylor, B. K. , Eastman, J. A. , Frenzel, M. R. , Embury, C. M. , Wang, Y. P. , Calhoun, V. D. , Stephen, J. M. , & Wilson, T. W. (2021). Neural oscillations underlying selective attention follow sexually divergent developmental trajectories during adolescence. Developmental Cognitive Neuroscience, 49, 100961. 10.1016/j.dcn.2021.100961 [DOI] [PMC free article] [PubMed] [Google Scholar]
- Taylor, B. K. , Embury, C. M. , Heinrichs‐Graham, E. , Frenzel, M. R. , Eastman, J. A. , Wiesman, A. I. , Wang, Y. , Calhoun, V. D. , Stephen, J. M. , & Wilson, T. W. (2020). Neural oscillatory dynamics serving abstract reasoning reveal robust sex differences in typically‐developing children and adolescents. Developmental Cognitive Neuroscience, 42, 100770. [DOI] [PMC free article] [PubMed] [Google Scholar]
- Trevarrow, M. P. , Kurz, M. J. , McDermott, T. J. , Wiesman, A. I. , Mills, M. S. , Wang, Y. P. , Calhoun, V. D. , Stephen, J. M. , & Wilson, T. W. (2019). The developmental trajectory of sensorimotor cortical oscillations. NeuroImage, 184, 455–461. 10.1016/j.neuroimage.2018.09.018 [DOI] [PMC free article] [PubMed] [Google Scholar]
- Uusitalo, M. A. , & Ilmoniemi, R. J. (1997). Signal‐space projection method for separating MEG or EEG into components. Medical & Biological Engineering & Computing, 35(2), 135–140. 10.1007/bf02534144 [DOI] [PubMed] [Google Scholar]
- Van Veen, B. D. , van Drongelen, W. , Yuchtman, M. , & Suzuki, A. (1997). Localization of brain electrical activity via linearly constrained minimum variance spatial filtering. IEEE Transactions on Biomedical Engineering, 44(9), 867–880. 10.1109/10.623056 [DOI] [PubMed] [Google Scholar]
- Vijayakumar, N. , Op de Macks, Z. , Shirtcliff, E. A. , & Pfeifer, J. H. (2018). Puberty and the human brain: Insights into adolescent development. Neuroscience and Biobehavioral Reviews, 92, 417–436. 10.1016/j.neubiorev.2018.06.004 [DOI] [PMC free article] [PubMed] [Google Scholar]
- Wierenga, L. M. , Langen, M. , Oranje, B. , & Durston, S. (2014). Unique developmental trajectories of cortical thickness and surface area. NeuroImage, 87, 120–126. 10.1016/j.neuroimage.2013.11.010 [DOI] [PubMed] [Google Scholar]
- Wiesman, A. I. , Heinrichs‐Graham, E. , Proskovec, A. L. , McDermott, T. J. , & Wilson, T. W. (2017). Oscillations during observations: dynamic oscillatory networks serving visuospatial attention. Human Brain Mapping, 38(10), 5128–5140. 10.1002/hbm.23720 [DOI] [PMC free article] [PubMed] [Google Scholar]
- Wiesman, A. I. , O'Neill, J. , Mills, M. S. , Robertson, K. R. , Fox, H. S. , Swindells, S. , & Wilson, T. W. (2018). Aberrant occipital dynamics differentiate HIV‐infected patients with and without cognitive impairment. Brain, 141(6), 1678–1690. 10.1093/brain/awy097 [DOI] [PMC free article] [PubMed] [Google Scholar]
- Wiesman, A. I. , & Wilson, T. W. (2019). The impact of age and sex on the oscillatory dynamics of visuospatial processing. NeuroImage, 185, 513–520. 10.1016/j.neuroimage.2018.10.036 [DOI] [PMC free article] [PubMed] [Google Scholar]
- Wiesman, A. I. , & Wilson, T. W. (2020). Attention modulates the gating of primary somatosensory oscillations. NeuroImage, 211, 116610. 10.1016/j.neuroimage.2020.116610 [DOI] [PMC free article] [PubMed] [Google Scholar]
- Witte, A. V. , Savli, M. , Holik, A. , Kasper, S. , & Lanzenberger, R. (2010). Regional sex differences in grey matter volume are associated with sex hormones in the young adult human brain. NeuroImage, 49(2), 1205–1212. 10.1016/j.neuroimage.2009.09.046 [DOI] [PubMed] [Google Scholar]
- Woo, C. W. , Krishnan, A. , & Wager, T. D. (2014). Cluster‐extent based thresholding in fMRI analyses: Pitfalls and recommendations. NeuroImage, 91, 412–419. 10.1016/j.neuroimage.2013.12.058 [DOI] [PMC free article] [PubMed] [Google Scholar]
- Worsley, K. J. , Marrett, S. , Neelin, P. , Vandal, A. C. , Friston, K. J. , & Evans, A. C. (1996). A unified statistical approach for determining significant signals in images of cerebral activation. Human Brain Mapping, 4(1), 58–73. [DOI] [PubMed] [Google Scholar]
Associated Data
This section collects any data citations, data availability statements, or supplementary materials included in this article.
Supplementary Materials
Appendix S1 Supporting information
Data Availability Statement
All data that support the findings of this study are available upon reasonable request to the corresponding author (TWW). Data will be made publicly available upon study completion.