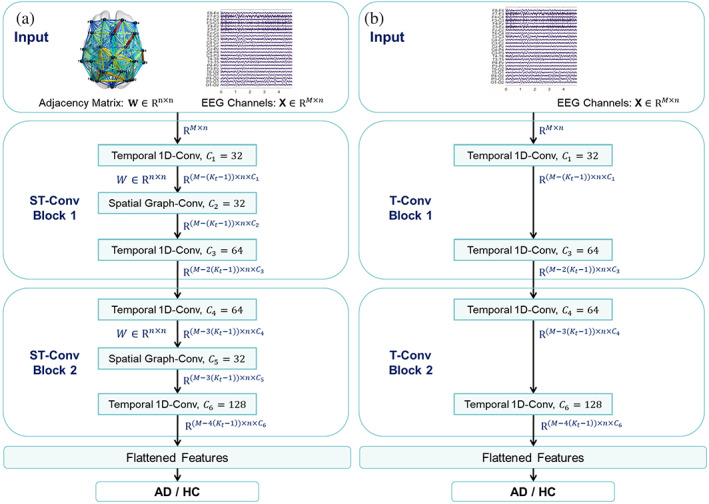
FIGURE 1.

The flowchart of (a) the proposed ST‐GCN framework and (b) the T‐CNN framework for comparison. is sized M*N (M = 25, representing the length of the mini‐epoch channel; N = 23, representing the 23 channels) and the input is sized N*N. The (i,j)th entry of the adjacency matrix denotes spatial coupling correlation strength between the ith and jth of all the 23 different channels, the detailed calculation of which is presented in section 2.2. is the size of the temporal 1D‐Conv filter, set as 3 here. is the number of filters in each layer. The estimated computational complexity of ST‐GCN and T‐CNN are 54M and 52M, respectively
