
Fig. 1. Overview of Tabula Sapiens.
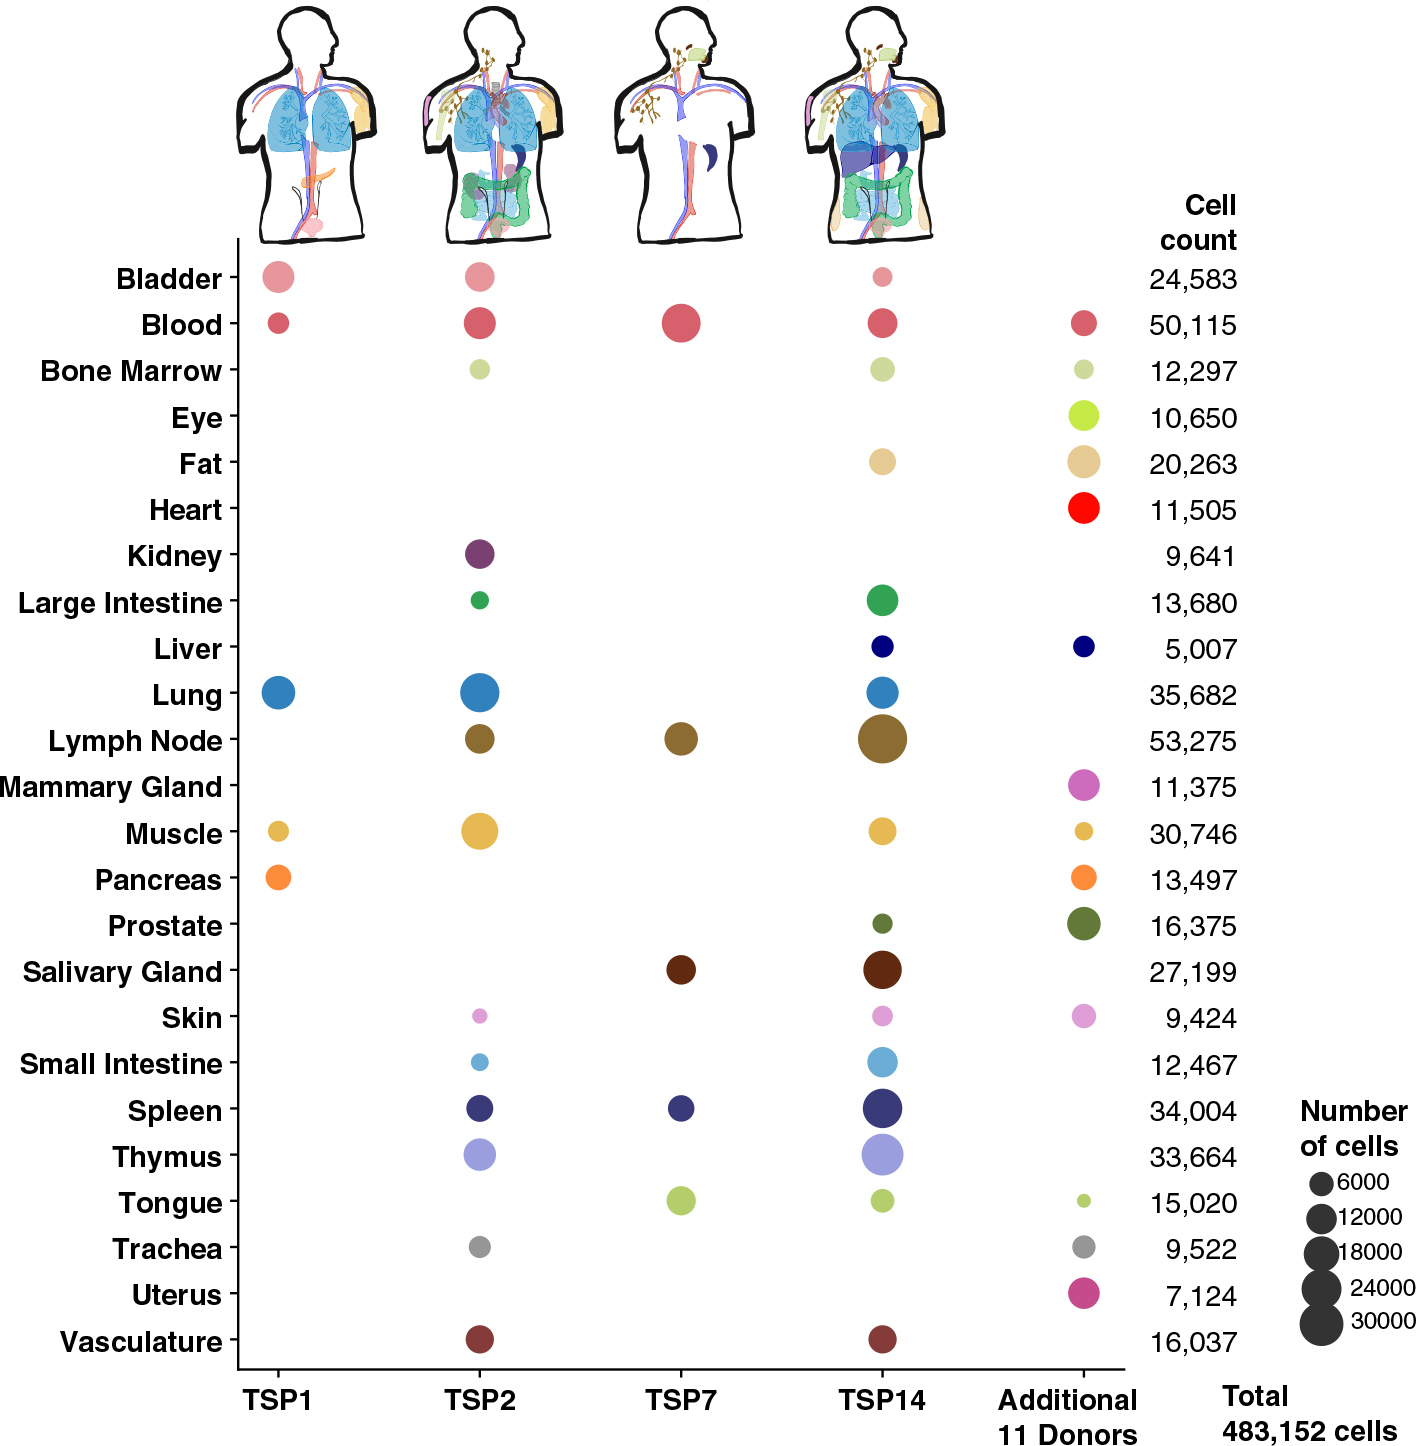
The Tabula Sapiens was constructed with data from 15 human donors; for detailed information on which tissues were examined for each donor, please refer to table S2. Demographic and clinical information about each donor is listed in the supplementary materials and methods and in table S1. Donors 1, 2, 7, and 14 contributed the largest number of tissues each, and the number of cells from each tissue is indicated by the size of each circle. Tissue contributions from additional donors who contributed single or small numbers of tissues are shown in the additional 11 donors column, and the total number of cells for each organ are shown in the final column on the right.