
Fig. 5. Dynamic changes in cell state.
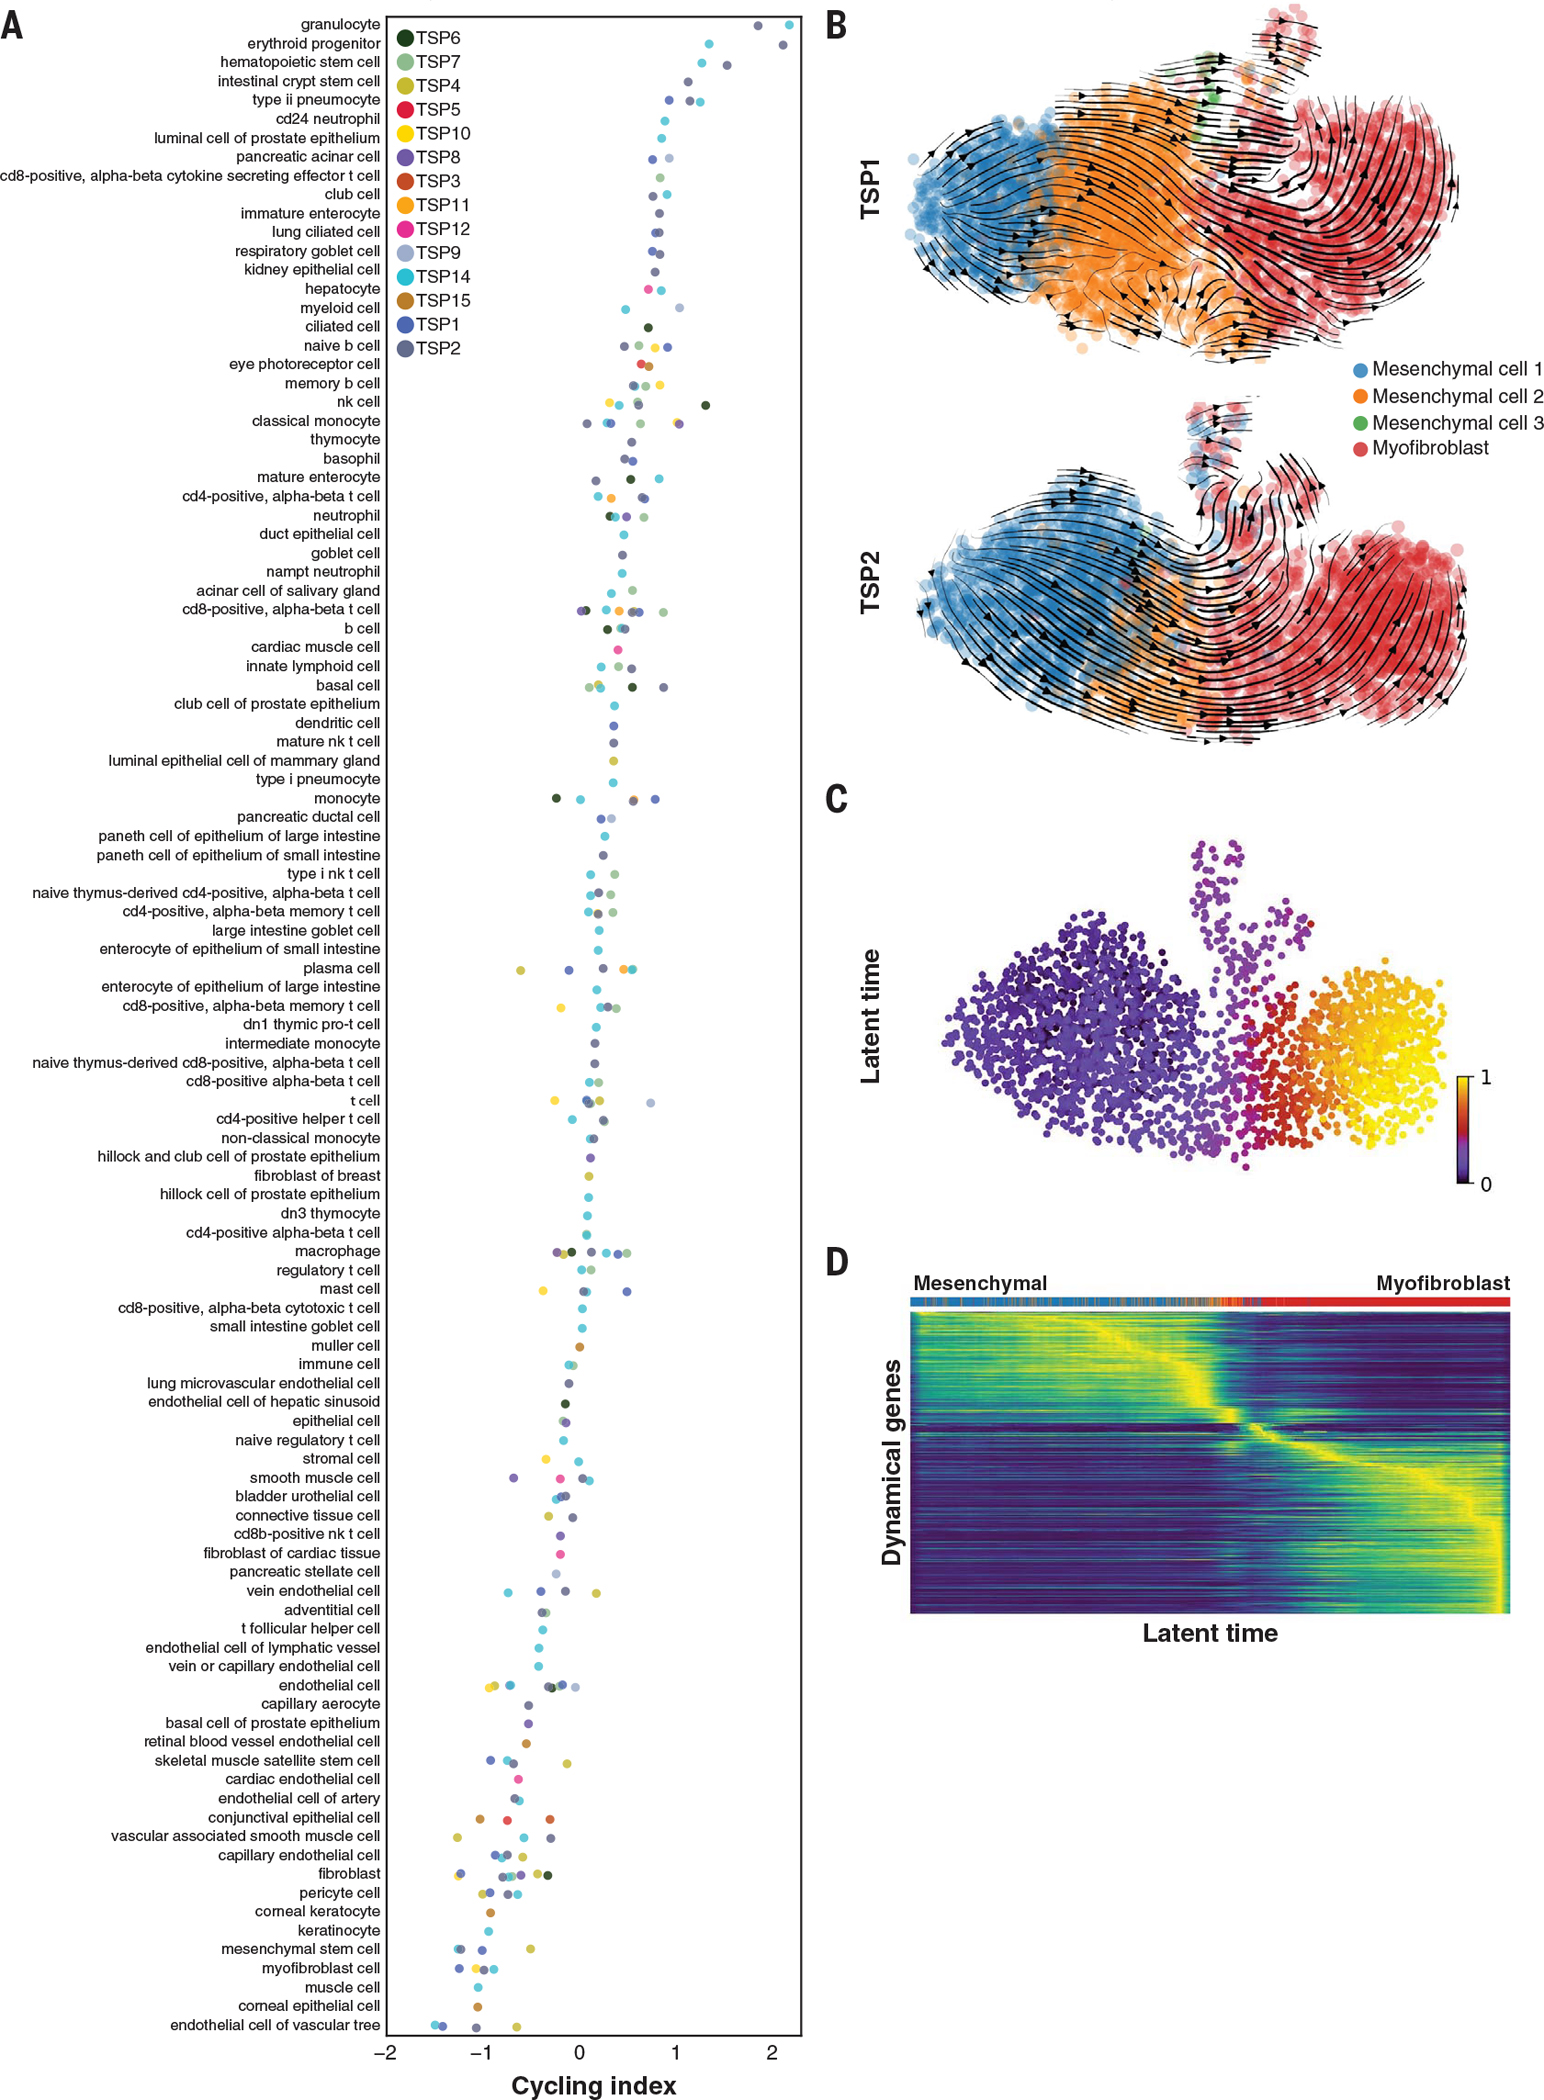
(A) Cell types ordered by magnitude of cell cycling index per donor (each a separate color), with the most highly proliferative at the top and quiescent cells at the bottom of the list. (B) RNA velocity analysis demonstrating mesenchymal-to-myofibroblast transition in the bladder. The arrows represent a flow derived from the ratio of unspliced to spliced transcripts, which in turn predicts dynamic changes in cell identity. (C and D) Latent time analysis of the mesenchymal-to-myofibroblast transition in the bladder, demonstrating stereotyped changes in gene expression trajectory.