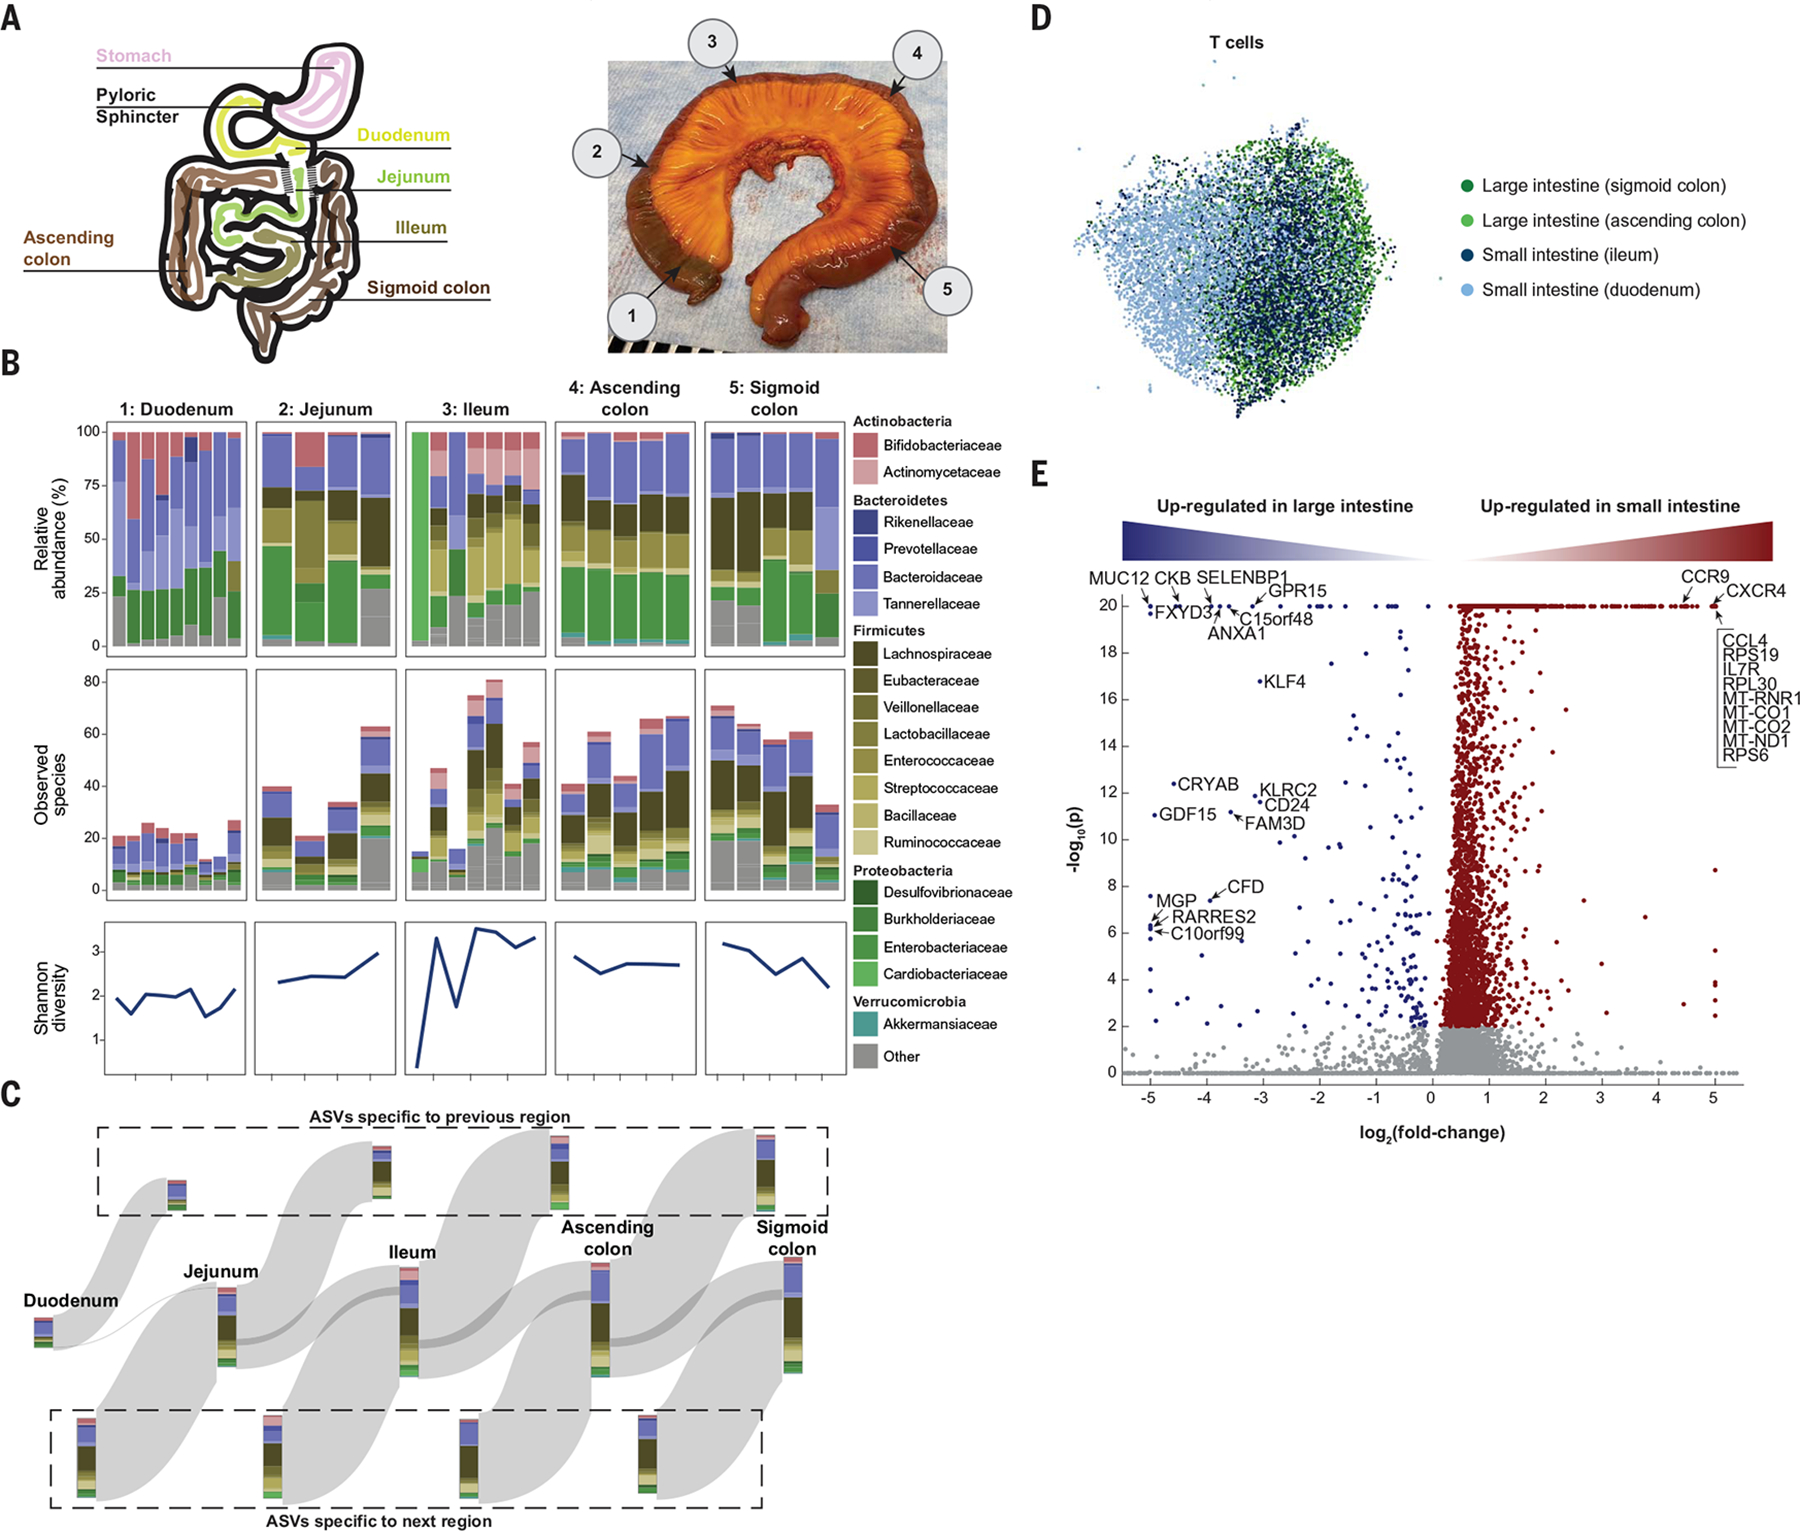
Fig. 6. High-resolution view highlights patchiness of the gut microbiome.

(A) Schematic (left) and photo (right) of the colon from donor TSP2, with numbers 1 to 5 representing microbiota sampling locations. (B) Relative abundances and richness (number of observed species) at the family level in each sampling location, as determined by 16S rRNA sequencing. The Shannon diversity, a metric of evenness, mimics richness. Variability in relative abundance and/or richness or Shannon diversity was higher in the duodenum, jejunum, and ileum compared with the ascending and sigmoid colon. (C) A Sankey diagram showing the inflow and outflow of microbial species from each section of the gastrointestinal tract. The stacked bar for each gastrointestinal section represents the number of observed species in each family as the union of all sampling locations for that section. The stacked bar flowing out represents gastrointestinal species not found in the subsequent section, and the stacked bar flowing into each gastrointestinal section represents the species not found in the previous section. ASVs, amplicon sequence variants. (D) UMAP clustering of T cells reveals distinct transcriptome profiles in the distal and proximal small and large intestines. (E) Dots in volcano plot highlight genes up-regulated in the large (left) and small (right) intestines. Labeled dots include genes with known roles in trafficking, survival, and activation.
