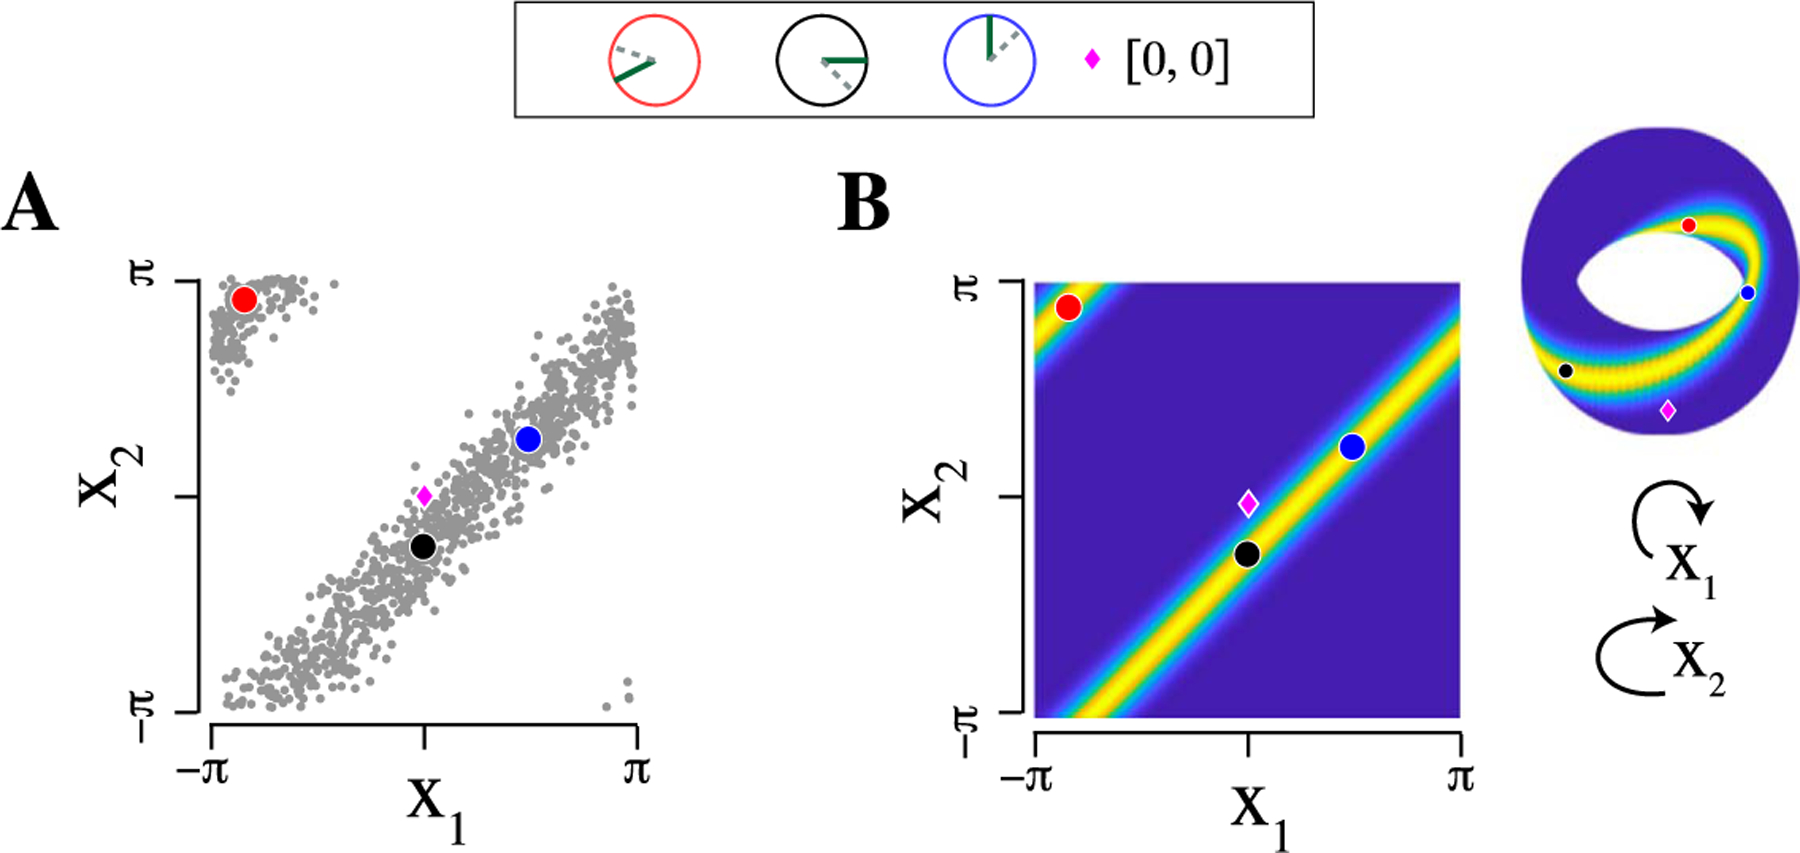
Fig. 1.

Rectangular coordinates are unable to accurately represent strong positive association between two circular random variables. (A) Scatter plot of simulated observations from a pair of dependent circular variables in rectangular coordinates, with three observations highlighted in red, black, and blue (simulated plot is similar to real data plots, but somewhat more concentrated for visual clarity; see Klein et al. (2020a), Figure S5). The highlighted observations are shown on circles at the top of the figure (one angle as a dashed line, one as a solid line; positive dependence implies a consistent offset between the angles). While the black and blue points follow the diagonal line, the red point falls near the upper left corner due to conversion to rectangular coordinates. (B) Probability density representing the two variables, plotted both in rectangular coordinates and on the torus, with the same three points marked. On the torus, there is a single band with high probability, which wraps around and connects to itself as a Möbius strip, and all three points fall on this strip.
