
Fig. 4.
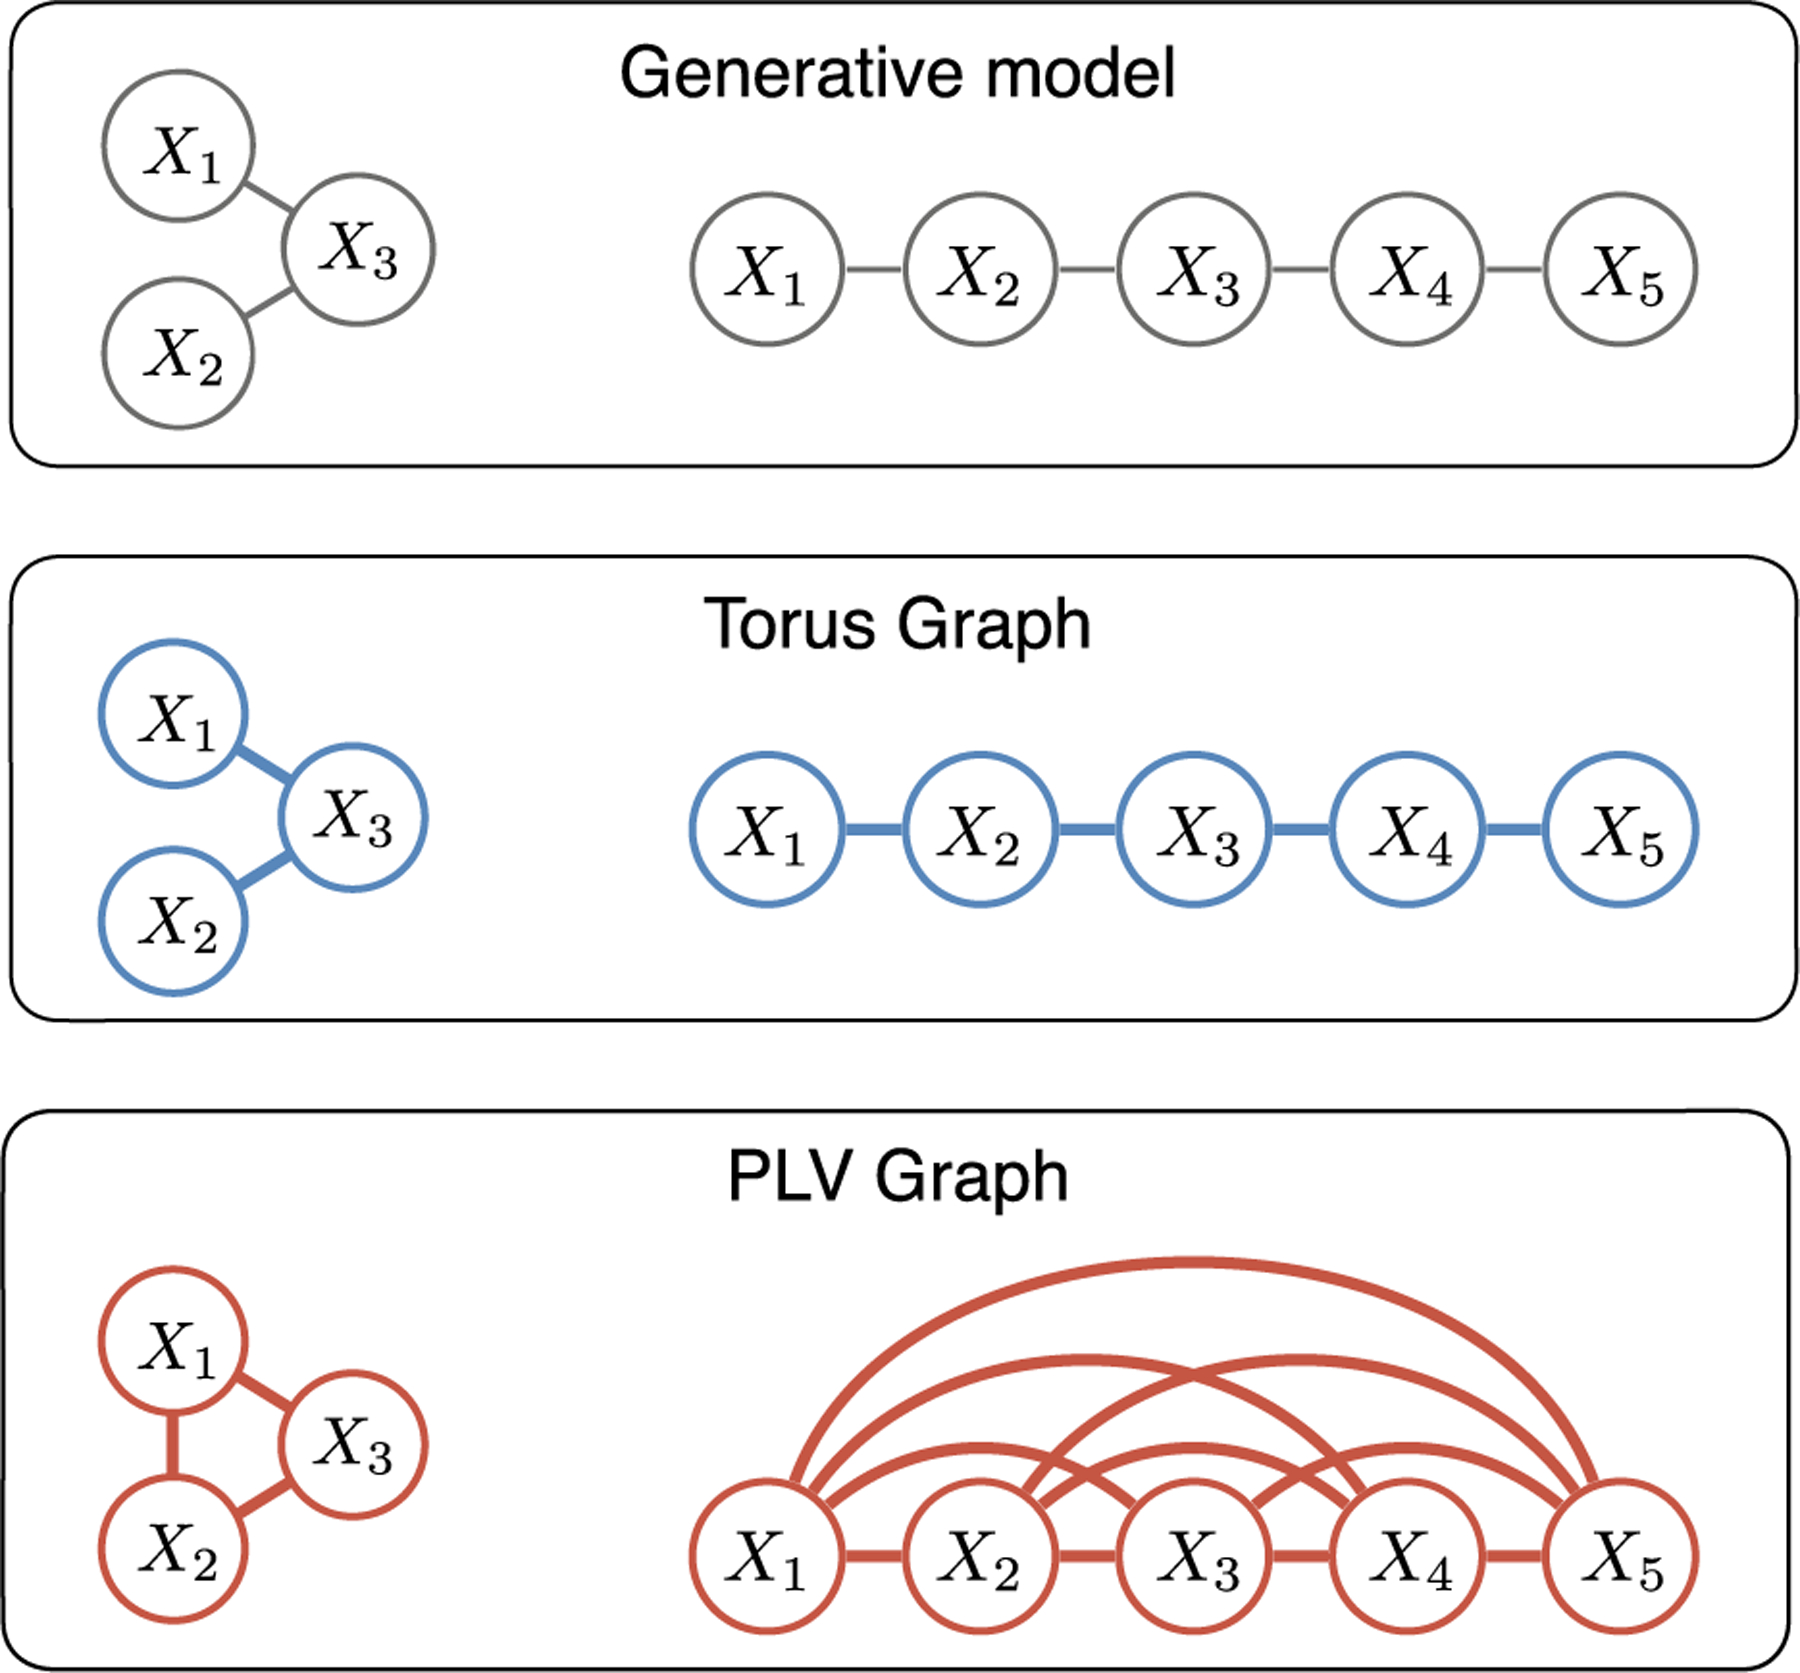
The torus graph recovers the ground truth graph structures (top panel) from realistic simulated data sets while a bivariate phase coupling measure, phase locking value (PLV), does not (edges shown for corrected p < 0.001). Left: a 3-dimensional simulated example of cross-area phase coupling where regions X1 and X2 are not directly coupled, but are both coupled to region X3. Right: a 5-dimensional simulated example of a graph structure that could be observed for channels on a linear probe with nearest-neighbor spatial dependence. In both cases, PLV infers a fully-connected graph due to indirect connections.