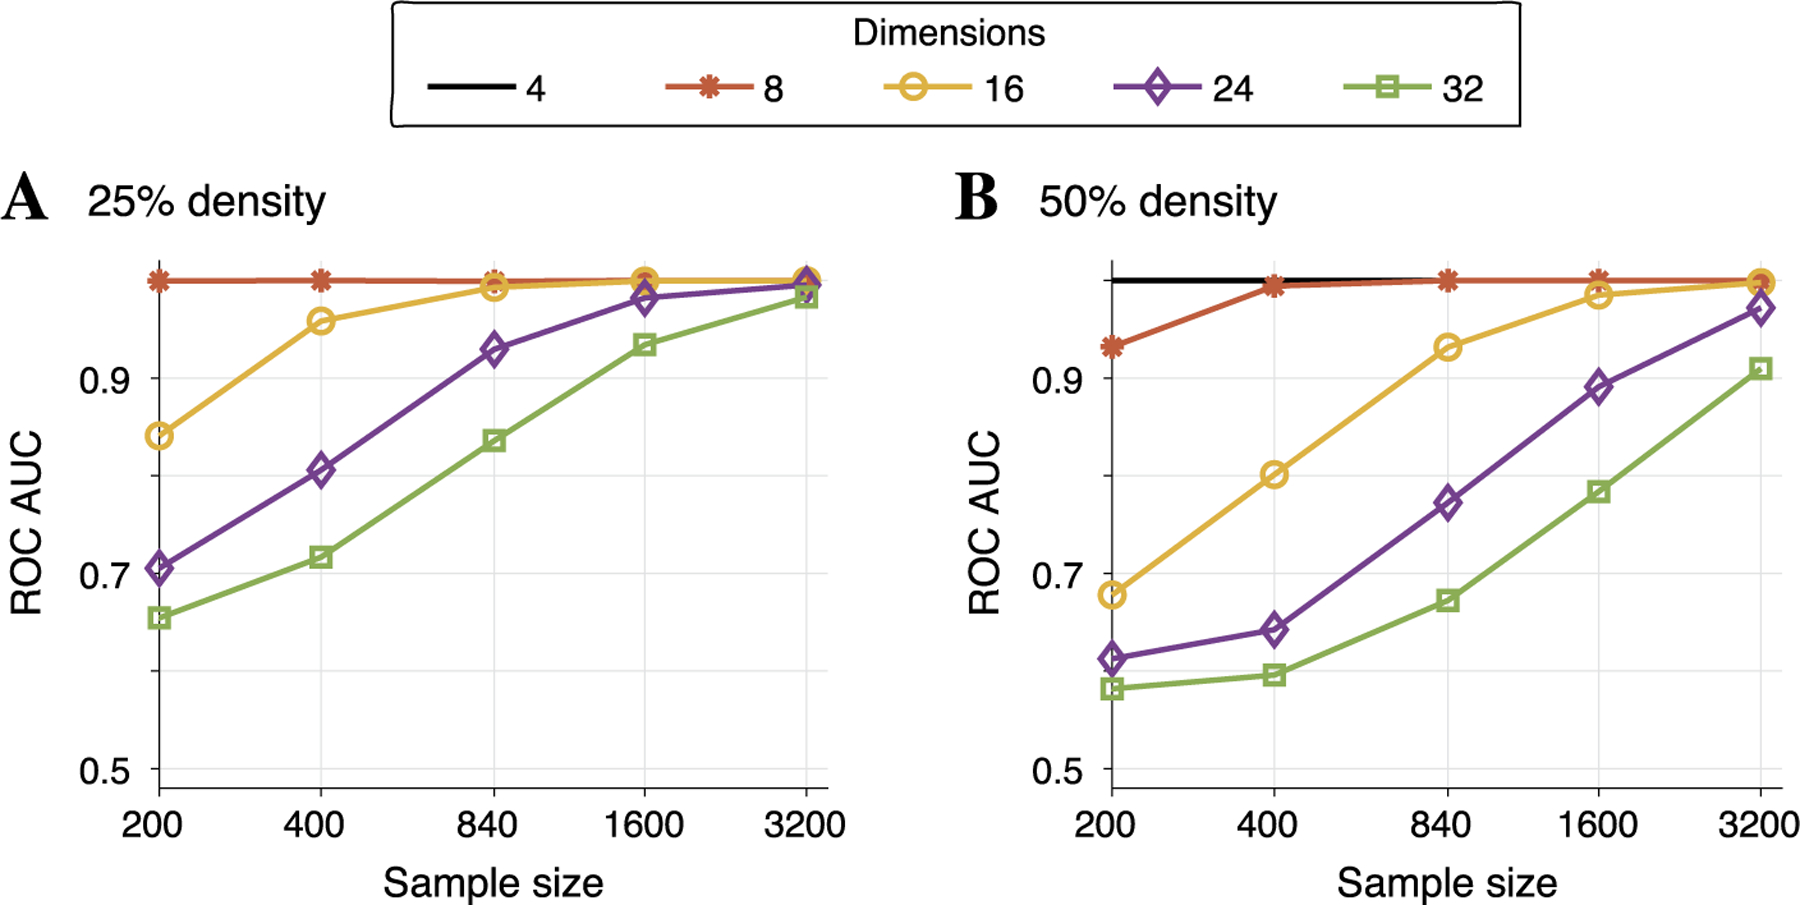
Fig. 5.

In simulated data with two different underlying edge densities, the average ROC curve area under the curve (AUC) was computed across 30 simulated data sets as a function of sample size (shown along the horizontal axis). The dimension of the data is indicated by line color and different markers. Panel A demonstrates that if the true underlying graph has only 25% of all possible edges present, then even for 24 dimensional data (diamond markers), a sample size of 840 (the size of our real LFP data set) is sufficient to reach AUC above 0.9. While performance degrades when the underlying graph is more dense, panel B shows that performance is still reasonable (AUC near 0.8) for 24 dimensional data with 840 samples.
