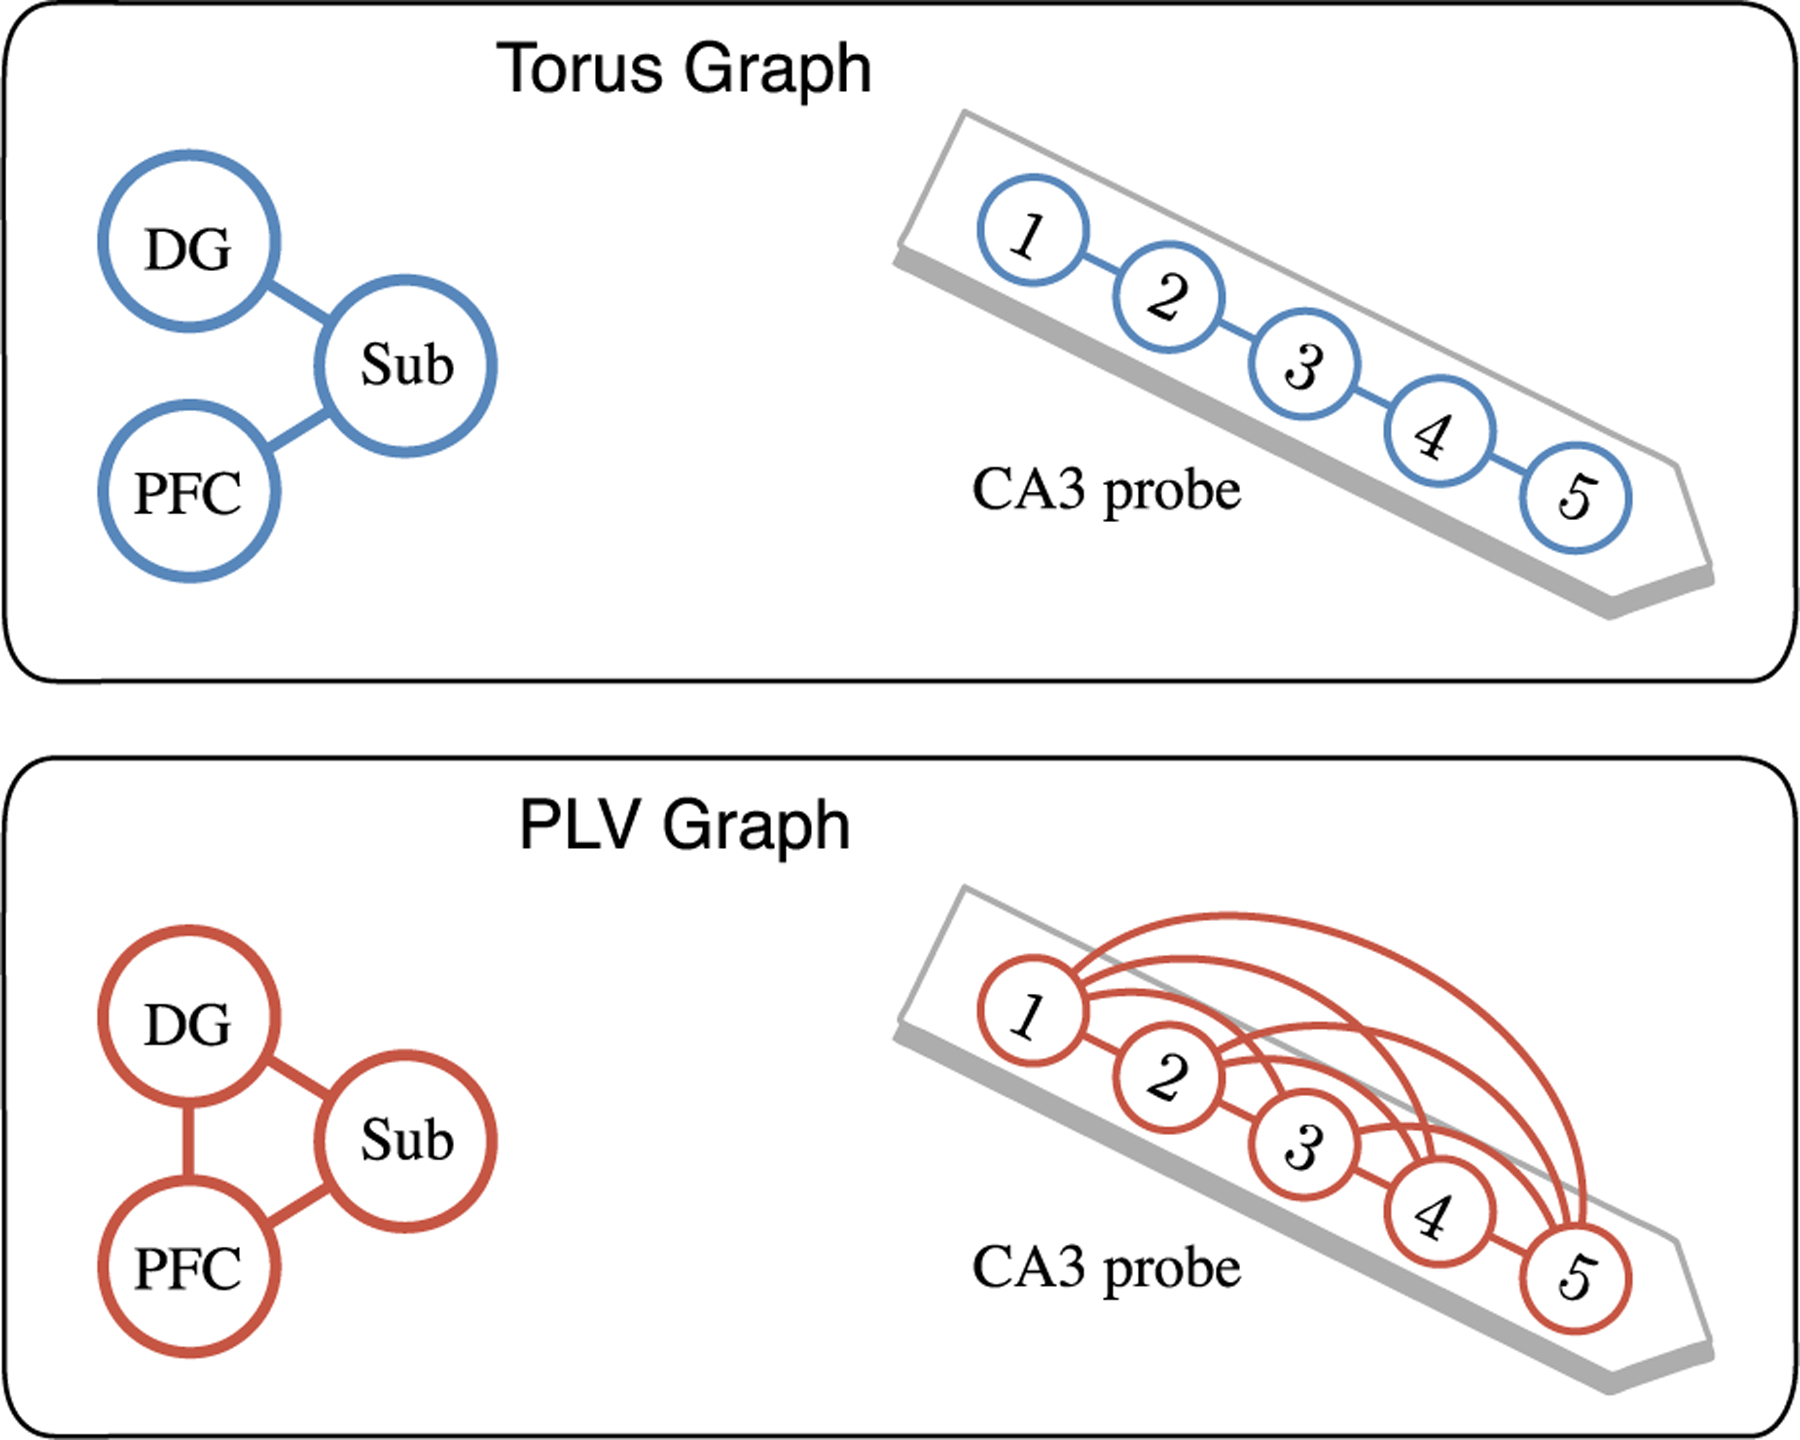
Fig. 7.

Torus graphs and PLV graphs from low-dimensional networks of interest in LFP data. Left: cross-region connectivity between dentate gyrus (DG), subiculum (Sub), and PFC, where the torus graph (top panel) indicated that DG and PFC are each coupled to Sub; in contrast, PLV (bottom panel) inferred a fully-connected graph. Right: within-region connectivity in CA3, where the torus graph indicated a spatial dependence structure which reflects the placement of channels along a linear probe, while PLV inferred a fully-connected graph.
