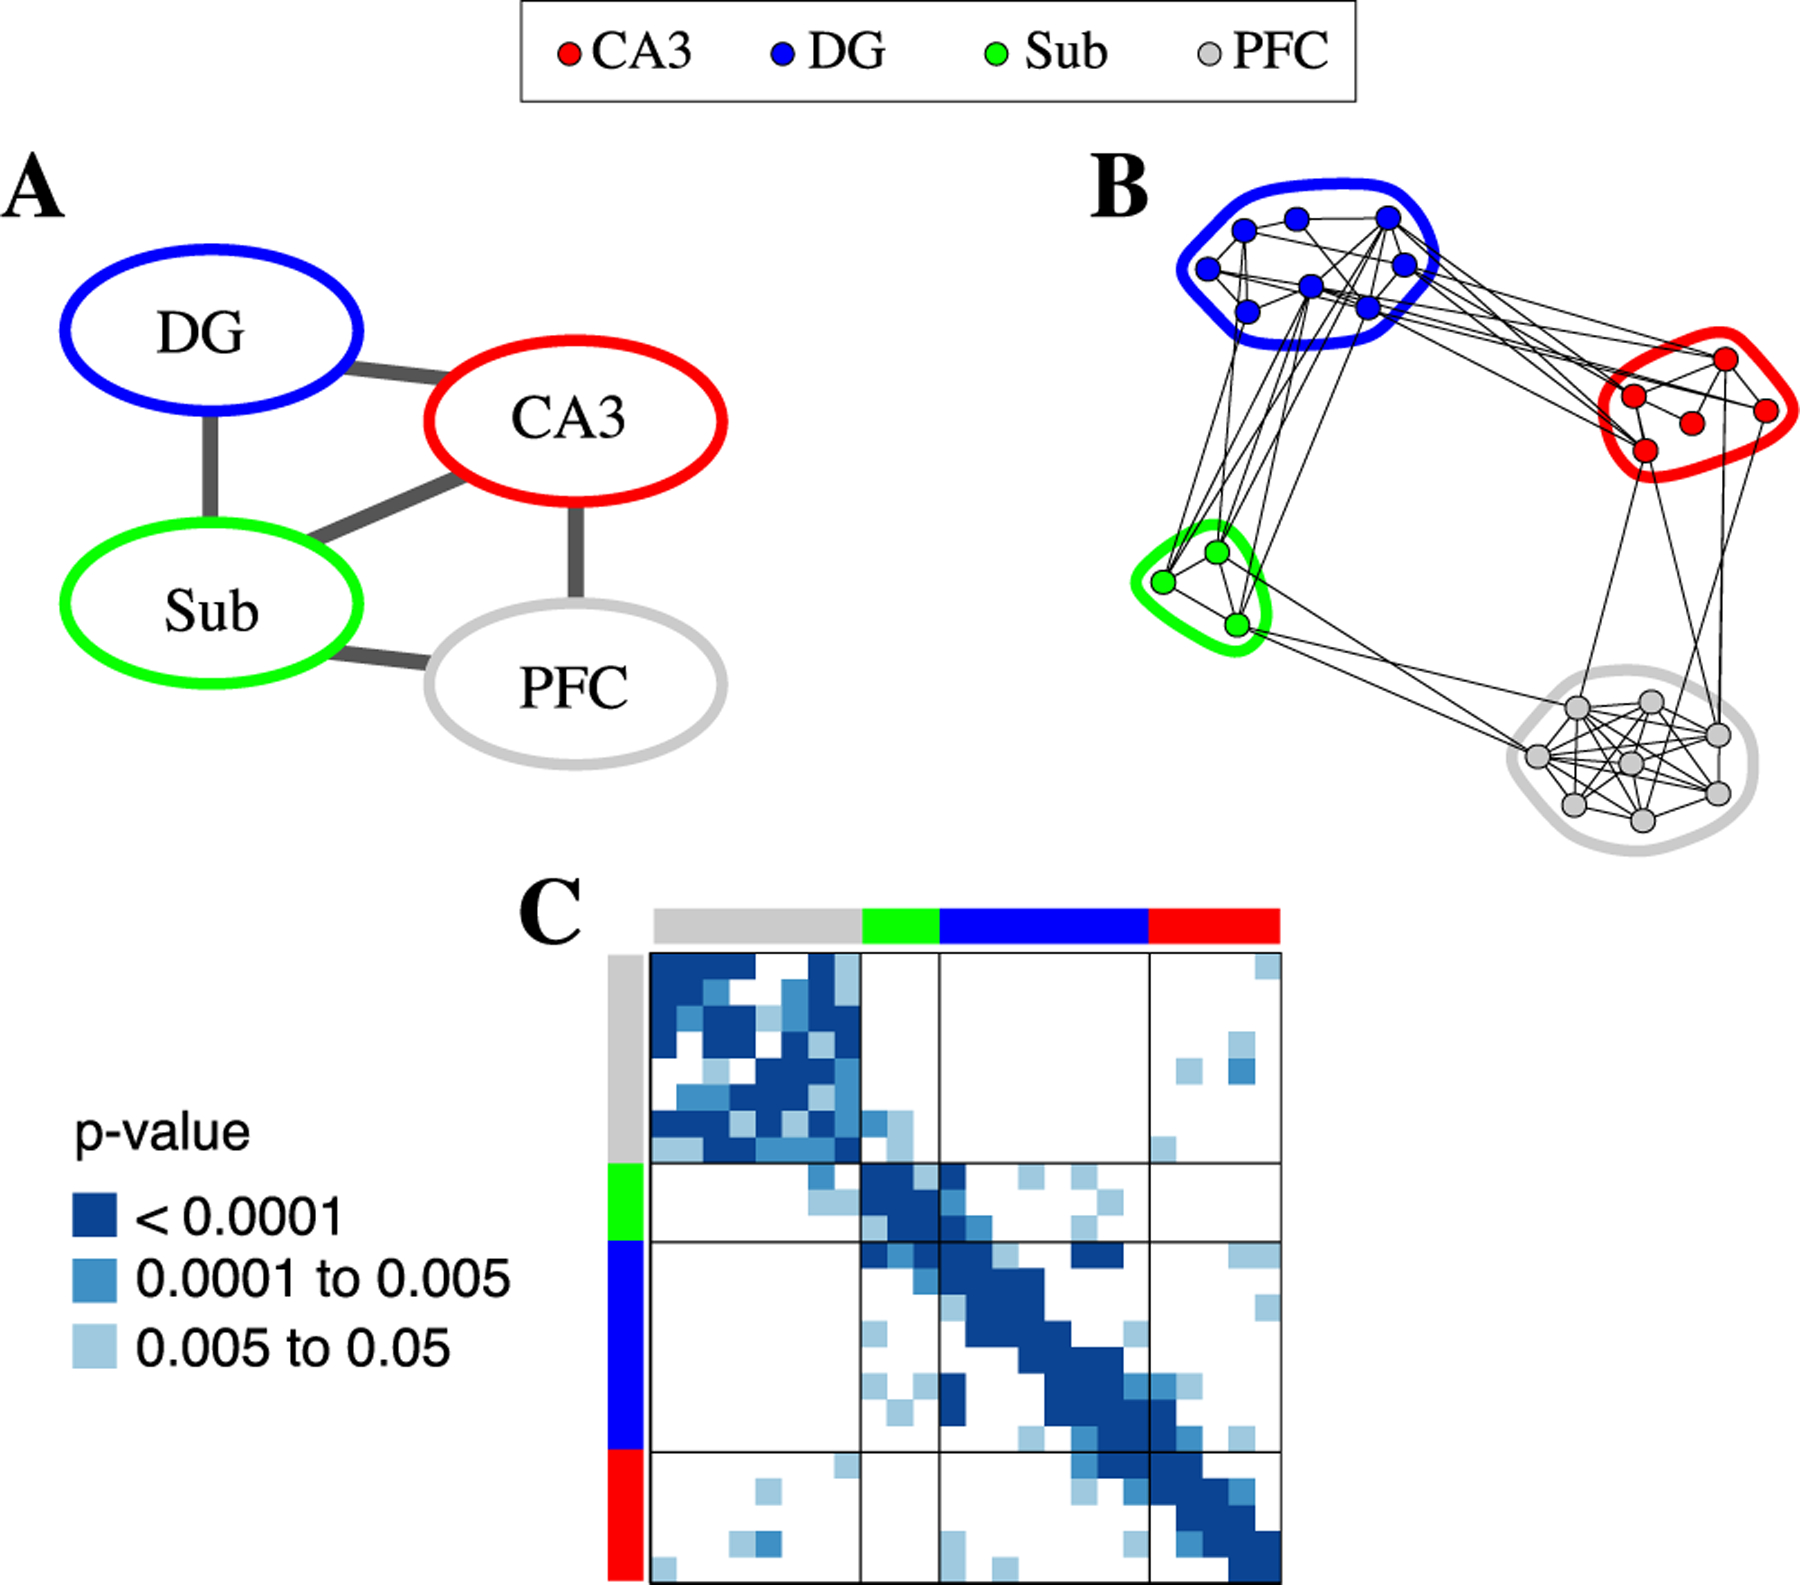
Fig. 8.

Torus graph analysis of coupling in 24-dimensional LFP data with four distinct regions: CA3 (red), dentate gyrus (DG; blue), subiculum (Sub; green), and prefrontal cortex (PFC; grey). (A) Cross-region tests indicated evidence for edges between DG and CA3, DG and Sub, CA3 and Sub, PFC and CA3, and PFC and Sub (determined by testing the null hypothesis that there were no edges between a given pair of regions, corrected p < 0.001). (B) For the significant cross-region connections, a post-hoc edgewise significance test examined the specific connections between regions, with the 24-dimensional graph containing edges for p < 0.05. Compared to the cross-region graph in A, notice that no edges from Sub to CA3 were individually significant at p < 0.05. (C) The 24-dimensional adjacency matrix (with hippocampal electrodes ordered by position on linear probe) with non-significant cross-region connections in white and other entries colored by edgewise p-value (with p > 0.05 in white). Despite having no built-in knowledge of spatial information, the torus graph recovered the linear probe structure within hippocampus.
