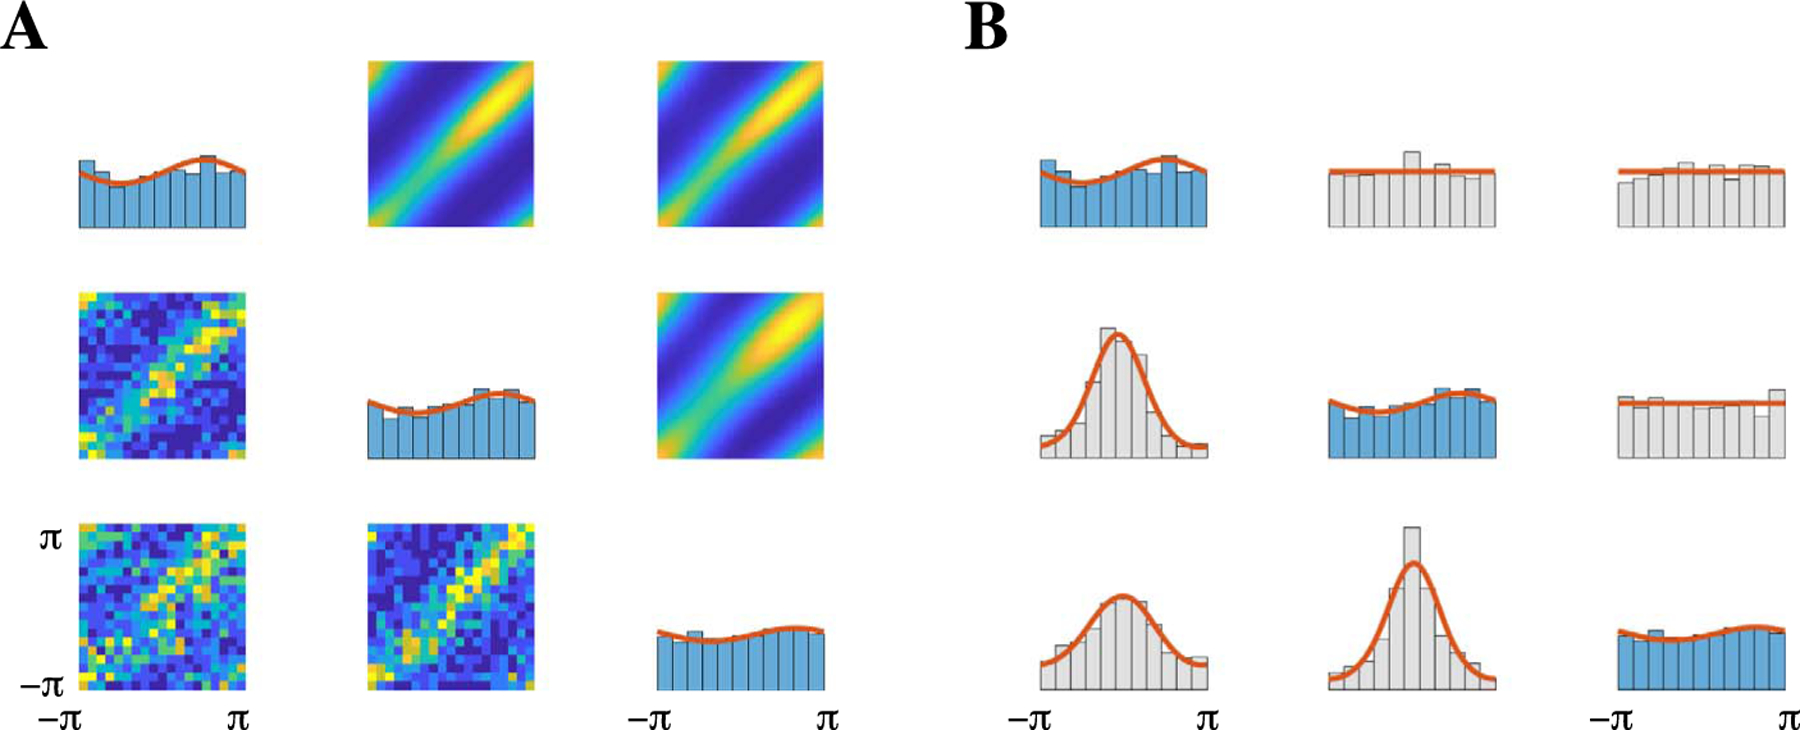
Fig. 9.

Comparison between phase angles from three LFPs located in PFC and the theoretical torus graph distribution demonstrates that torus graphs capture the salient first- and second-order behavior present in the LFP phase angles. In contrast, the sine model fails to fit the data accurately (Klein et al. (2020a), Figure S6). (A) Along the diagonal are the marginal distributions of the phase angles. The real data are represented by blue histograms and the theoretical marginal densities from the torus graph model are overlaid as solid red traces. Two-dimensional distributions (off-diagonal) show bivariate relationships, with theoretical densities above the diagonal and real data represented using two-dimensional histograms below the diagonal. (B) Plots along the diagonal same as panel A. Below the diagonal are distributions of pairwise phase differences and above the diagonal are distributions of pairwise phase sums, represented by histograms for the real data and by solid red density plots for the theoretical torus graph model. Both the real data and theoretical distributions exhibit concentration of phase differences but not phase sums, suggesting prevalence of rotational covariance, and the sufficient statistics are very similar for the theoretical and real data.
