Figure 3.

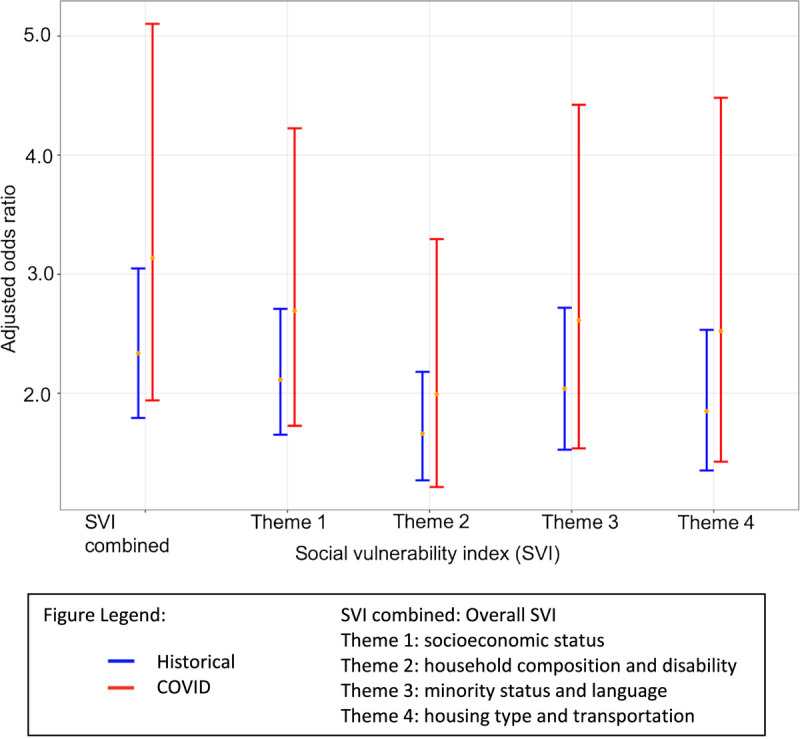
Adjusted odds of intentional injury as compared with unintentional injury in the COVID (red) and historical cohorts (blue) by combined SVI and by individual SVI subthemes.

Adjusted odds of intentional injury as compared with unintentional injury in the COVID (red) and historical cohorts (blue) by combined SVI and by individual SVI subthemes.