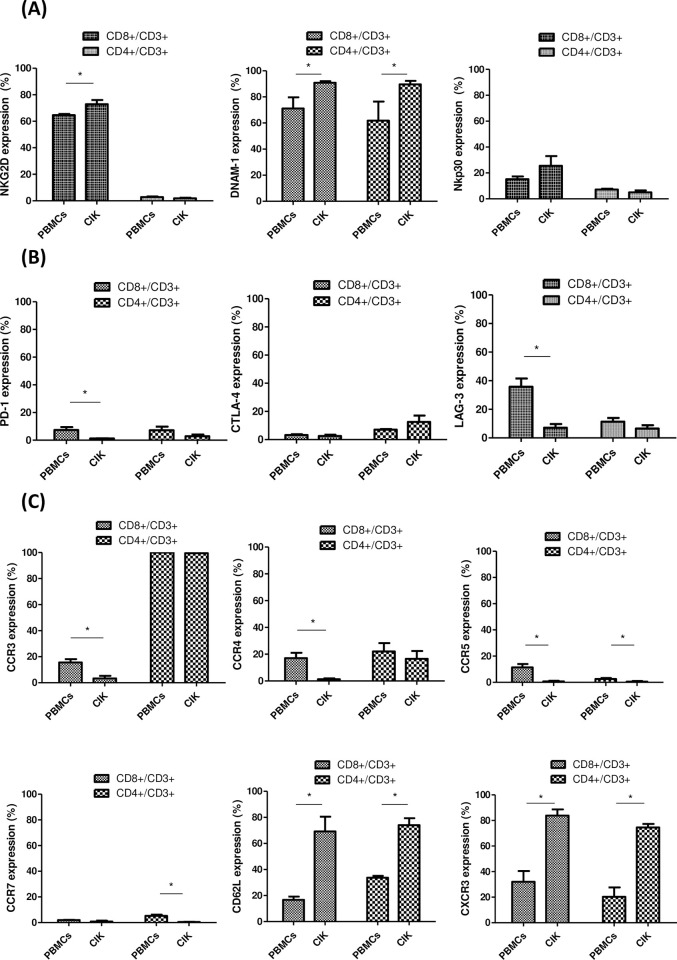
Fig 3. Expression profile of natural killer (NK) receptors, immune checkpoint molecules, and trafficking/activating molecules on CIK cells.
A. Percentage of NK receptors expression: NKG2D, DNAM-1, and NKp30 on CD8+ T cells (coarse granule bar) and CD4+ T cells (fine granule bar) compared with the total number of CD3+ T cells. B. Percentage of immune checkpoint molecules expressions of PD-1, CTLA-4, and LAG-3 on CD8+ T cells (coarse granule bar) and CD4+ T cells (fine granule bar) with respect to the total number of CD3+ T cells. C. Percentage of chemokine receptors expressions: of CCR3, CCR4, CCR5, CCR7, CD62L, and CXCR3 on CD8+ T cells (coarse granule bar) and CD4+ T cells (fine granule bar) compared with the total number of CD3+ T cells. (N = 5, *p < 0.05).

