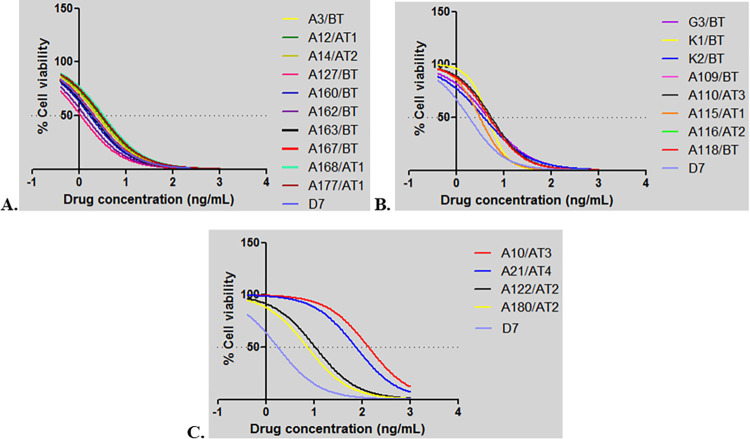
Fig 1. MTT assay of T. annulata infected cell lines.
A. T. annulata isolates with low IC50 values (2–3 ng/mL). B. T. annulata isolates with medium IC50 values (3–7 ng/mL). C. T. annulata isolates with IC50 values over (7 ng/mL). Numbers on the x axis (-1, 0, 1, 2, 3 and 4) indicates drug concentrations used to treat cell lines at doses of 0, 0.8, 7, 125, 1000 and 1500 ng/mL, respectively.

