
Fig. 3. In vivo mouse wound healing and histological studies.
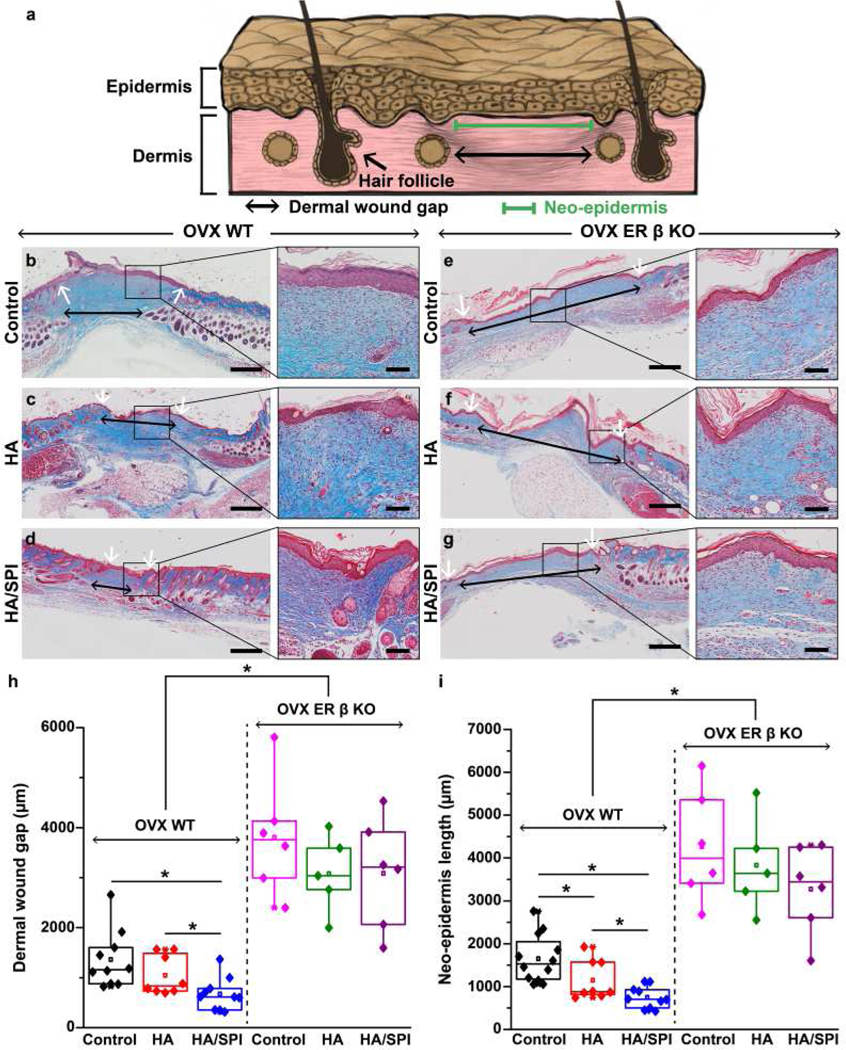
a, Schematic illustration of the wound healing evaluation parameters. b–g, Masson’s trichrome images of day 20 post-injury wounds treated with control (no treatment), HA scaffolds, and HA/SPI scaffolds for (b–d) OVX WT and (e–g) OVX ER-β KO mice with the zoom-in images of healed wounds on the right panels. Black and white arrows indicate dermal wound gaps and the edges of neo-epidermis, respectively. Scales of left and right panels are 500 and 100 μm, respectively. h–i, Quantitative analysis of skin tissue repair (h, dermal wound gap and i, neo-epidermis length) at day 20 post-injury. For statistical analysis, *p<0.05, For OVX WT mice, n=10 for the control and HA/SPI group, n=8 for the HA group. For OVX ER-β KO mice, n=6 for the control and HA/SPI group, n=5 for the HA group. Box plots with all data points overlapping show data where edges, middle bars, and whiskers indicated 25th and 75th percentiles, median, 5th and 95th percentiles, respectively.