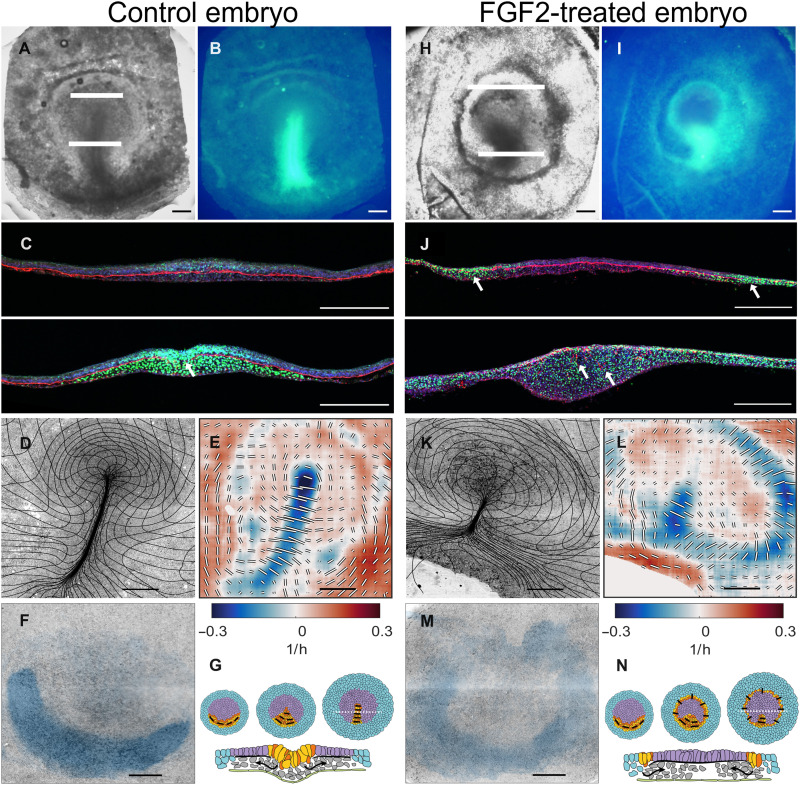
Fig. 1. Characterization of gastrulation for control embryo and after FGF2 treatment.
(A) Control, bright-field image of embryo at HH3+. (B) SNAI expression in embryo shown in (A). (C) Two sections taken at the white lines in (A) showing SNAI (green), FN1 (red), and actin (blue). Note that in the streak, the FN1 layer is fragmented as indicated by the white arrow. (D) Overview images of embryo from light sheet microscope at the end (HH3+) of the experiment overlaid with a deformation mesh. (E) Strain rate tensor for stages shown in (D). Isotropic strain rate component shown as color blue for contraction and red for expansion. The anisotropic part of the strain rate tensor is shown as black and white bars indicating the magnitude and direction of contraction. (F) Cells that will ingress through the streak [domain of attraction (DOA)] during the experiment calculated from the dynamic morphoskeleton (DM). (G) Schematic summary of development (stages HH1, HH2, and HH3), extraembryonic area in blue, mesendoderm precursors in yellow/red, and embryonic area in purple; black bars show the direction of cell intercalation, section taken at the broken white line in HH3 embryo schematic in (E). Scale bars, 500 μm except in (C), which is 250 μm. For (E) and (L), the anisotropic scale bar length represents 0.5/hour for the anisotropic component of the strain rate. (H to N) Same layout as (A) to (F) for FGF2-treated embryo for the same time as the control embryo. FGF (50 μg/ml on the hypoblast; see Materials and Methods)–treated embryos generate a circular primitive streak surrounding the epiblast (eight of eight treated embryos in the light sheet microscope).

