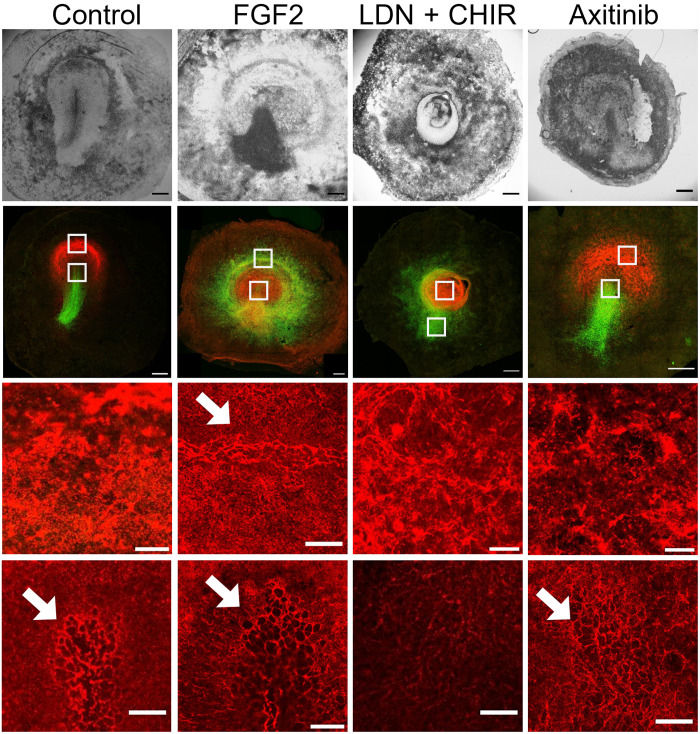
Fig. 3. Comparison of SNAI and FN1 expression after various perturbations.
Top row: Bright-field images of embryos after 16 hours in EC culture after various treatments. Second row: Confocal images of the embryos in the top row showing the expression of SNAI (green) and FN1 (red). Third and fourth rows: Higher-magnification images taken in front of the streak (top white square) and at the tip of the streak (bottom white square). It can be seen in the control (first row) that the region anterior to the streak expresses high levels of FN1, forming a densely packed meshwork of fibrils. In the streak, FN1 shows a larger pore meshwork (arrows) probably associated with cell ingressions. Note that in the ring-shaped streak after FGF treatment (second column), FN1 shows the same large porous structure as in the streak, indicating that this is also a region where the cells ingress. After LDN and axitinib treatment, the anterior region shows a dense fibrillar network, while in the streak or ring cases, the porous network is less well developed as in the control or after FGF treatment. The data show that the presence or absence of ingression is reflected in the FN1 network structure. Scale bars, 500 μm (two top rows) and 100 μm (two bottom rows).

