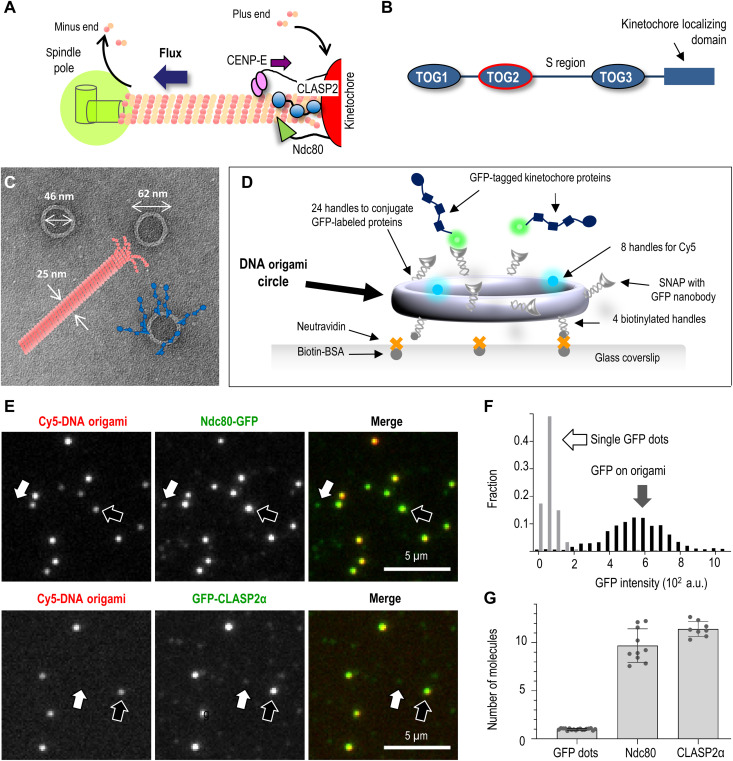
Fig. 1. Reconstruction of multivalent molecular clusters for kinetochore-microtubule interaction studies.
(A) Schematic of kinetochore microtubule plus-end and its coupling to the kinetochore, which clusters several microtubule-binding proteins, including CLASPs, the Ndc80 protein complex, and the plus-end–directed kinesin CENP-E. CLASP promotes the incorporation of tubulins at the kinetochore-bound microtubule plus-ends, sustaining poleward tubulin flux. (B) Schematic of functional domains in human CLASP2α (not to scale). (C) Electron microscopy image of the DNA origami circles with overlaid schematics of a microtubule (drawn to scale) and conjugated kinetochore proteins (blue). (D) The use of an immobilized DNA scaffold and conjugated GFP-tagged proteins to make a microtubule binding site. (E) Representative fluorescence images of Cy5-labeled DNA scaffolds (examples indicated by black arrows) with conjugated GFP-tagged proteins: human Ndc80 Broccoli and full-length CLASP2α. White arrows point to dim dots with GFP but not Cy5 fluorescence, representing single GFP-tagged protein molecules that attach nonspecifically. (F) Typical GFP intensity distribution of DNA scaffolds (n = 180) and dim dots (n = 527) based on one representative experiment with Ndc80-GFP, in which 13 image fields were analyzed. (G) The number of GFP-tagged molecules per DNA origami scaffold. Each dot represents the mean of the GFP intensity distributions from independent experiments plotted relative to the mean intensity of single GFP molecules. Error bars are SEMs. a.u., arbitrary units.

