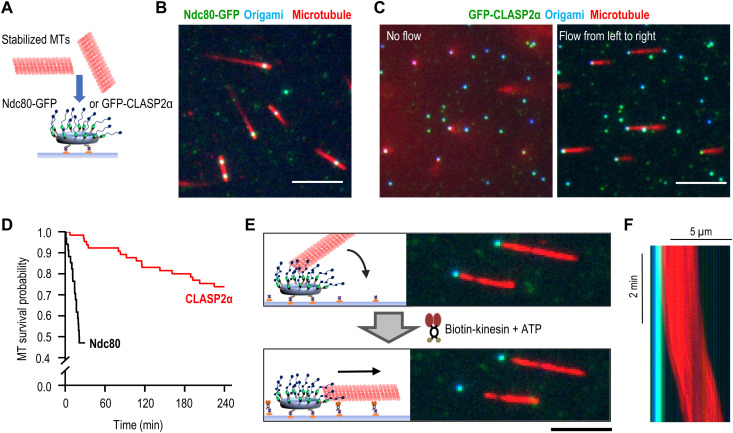
Fig. 2. End-on attachment of microtubules to molecular clusters of full-length CLASP2α protein.
(A) Schematic of experimental assay with a DNA origami circle attached to a coverslip and presenting clusters of microtubule-binding proteins to rhodamine-labeled taxol-stabilized microtubules (MTs). (B) Representative TIRF image of microtubules (red) bound to DNA origami scaffolds (blue) with clusters of GFP-tagged Ndc80 Broccoli (green). Scale bar, 5 μm. (C) Same as in (B) but with CLASP2α clusters and showing the same field with (right) or without (left) buffer flow. Scale bar, 5 μm. (D) Lifetime of microtubule association with the clusters of the indicated proteins. Kaplan-Meier survival plots were built on the basis of n microtubules observed in N independent experiments: for Ndc80, n = 34 and N = 2 and for CLASP2α, n = 65 and N = 3. (E) Schematic of the experiment and representative images of microtubules initially tethered at CLASP2α clusters but then dragged away by the coverslip-bound, plus-end–directed Kinesin-1 in the presence of 10 μM adenosine triphosphate (ATP). Scale bar, 5 μm. (F) Kymograph illustrating the lag period after addition of ATP and the persistence of the microtubule gliding away from the CLASP2α cluster [overlaid blue, green, and red images; see (B) for details]. Variations in red intensity are due to uneven illumination.

