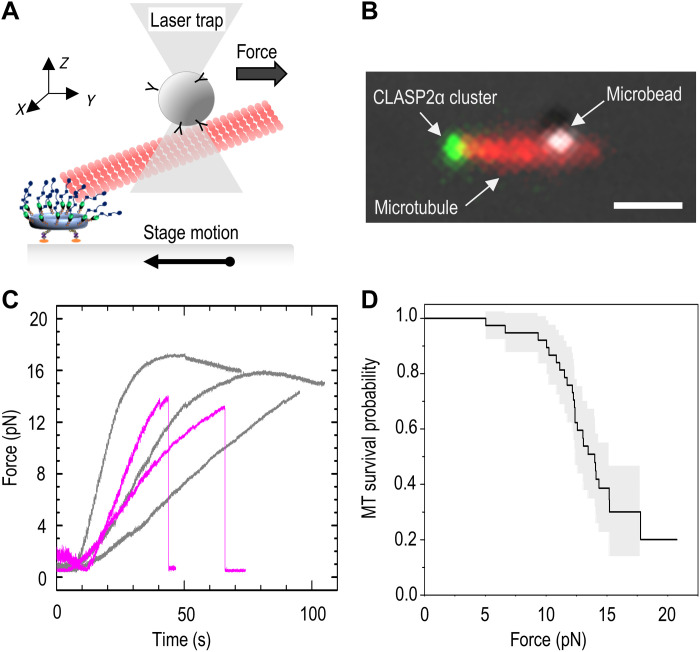
Fig. 3. Measuring the strength of a microtubule end-on attachment using laser trapping.
(A) Schematic of the experimental assay in which a pulling force is applied to the microtubule tethered at its plus-end to a coverslip-immobilized CLASP2α cluster. Microtubule is held in the laser trap via the trapped wall-bound microbead, while the stage is moved in the opposite direction until a bond is ruptured or the maximum force is reached with no rupture. (B) Representative fluorescence image of a taxol-stabilized rhodamine-labeled microtubule and the coverslip-bound CLASP2α cluster overlaid with the differential interference contrast image of the microtubule-bound bead. Because the bead is located several micrometers away from the coverslip (deep into the chamber), the microtubule image represents a projection, constructed by combining several images taken at different z planes. Scale bar, 1 μm. (C) Force application curves from individual experiments. Two typical outcomes are illustrated by these five curves. Gray curves show an increase in the pulling force followed by a gradual decrease, indicating that a maximal force was reached with no rupture. Curves in purple show similar increases in pulling force, followed by an abrupt drop, indicative of a rupture. (D) Kaplan-Meier survival plot based on 38 measurements from six independent experiments. The gray area corresponds to 95% confidence interval.

