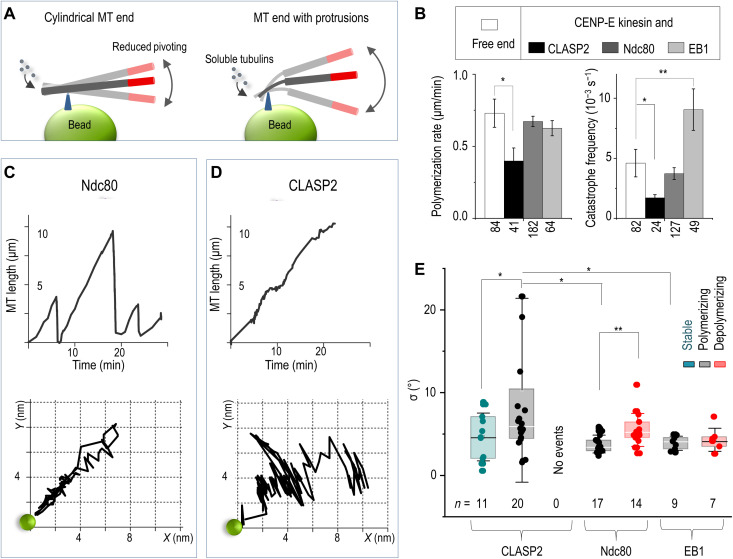
Fig. 7. Dynamics of the microtubule end tethered near bead-immobilized CLASP2α versus other microtubule-binding proteins.
(A) Integrity of microtubule plus-end is examined by tethering it to a coverslip-immobilized bead. Thermal pivoting of tethered microtubules is a sensitive gauge of protruding protofilaments, which can arise if one or several protofilaments at the assembling end became stalled. Larger pivoting angles are expected when microtubule is tethered via several protofilaments than via the tube-like tip owing to low protofilament rigidity. Drawings are not to scale; triangles depict the bead attachment sites at assembling microtubule tips. Microtubule motions are monitored via the labeled segments (red). (B) Dynamic parameters of the plus-end of freely growing microtubules and of the plus-ends coupled to beads coated with the indicated proteins. Columns (means ± SEM) are based on N ≥ 3 independent experiments and n examined microtubules; *P < 0.05 and **P < 0.001(Mann-Whitney U test; see Data Source file for details). (C) Microtubule length versus time (top) and the corresponding trajectory (bottom) of the distal end of a HyLite647-labeled microtubule segment relative to the CENP-E/Ndc80–containing bead (green circle; not to scale). This CENP-E/Ndc80–coupled end underwent three cycles of microtubule growth and shortening while moving back and forth along a relatively straight path. (D) Same as in (C) but for a typical bead coated with CLASP2α, which couples growing but not shortening microtubule tips (fig. S12). Coupled microtubule end grows persistently with small pauses and pivots occasionally around the bead. (E) SD values of the pivoting angles (parameter σ) around the microtubule-bead attachment site for coatings with the indicated proteins and different microtubule ends: GMPCPP stabilized, polymerizing, and depolymerizing (color-coded). Box: first, second, and third quartiles; whiskers: SD; n: the total number of analyzed microtubule end tracings; *P < 0.05 and **P < 0.01, Welch’s t test.

