
Figure 2 |. Sequencing biases in PacBio HiFi and Illumina reads.
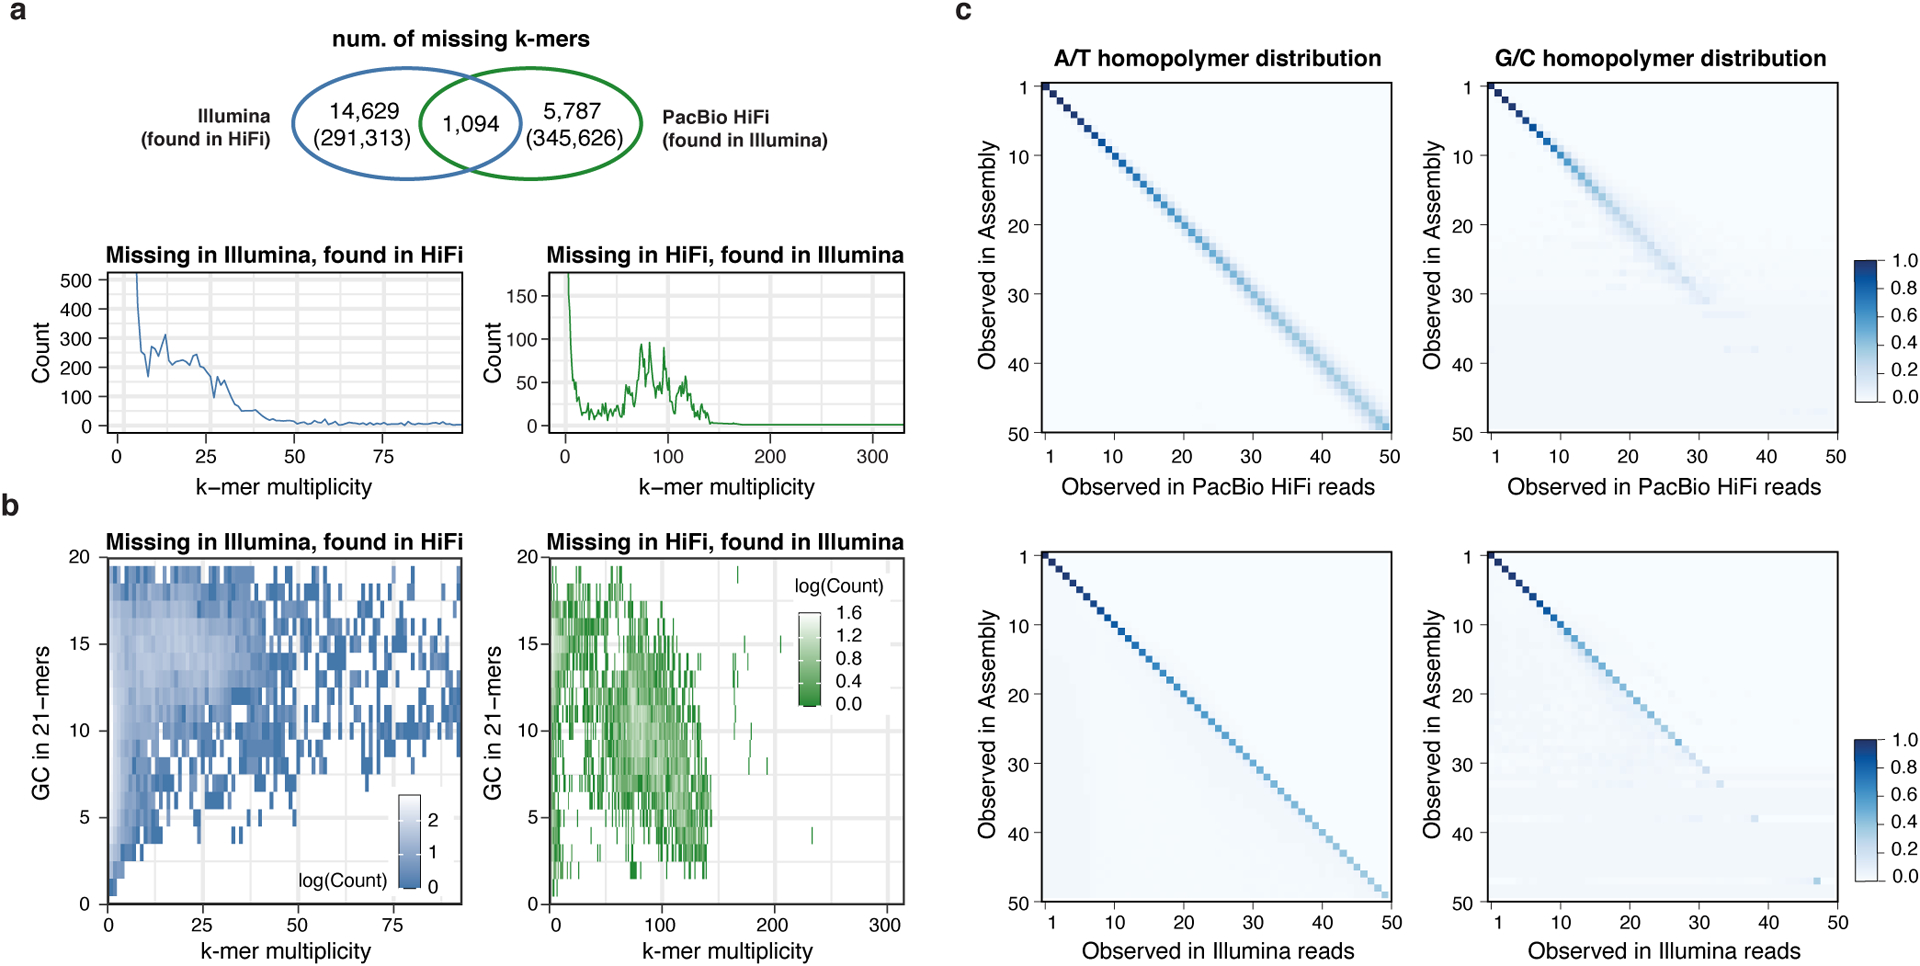
a, Venn Diagram of the “missing” k-mers found in the assembly but not in the HiFi reads (green) or Illumina reads (blue). Except for the 1,094 k-mers that were absent from both HiFi and Illumina reads, error k-mers were found in the other sequencing platform with expected frequency, matching the average sequencing coverage (lower panels). b, Missing k-mers from a with its GC contents, colored by the frequency observed. Low frequency erroneous k-mers did not have a clear GC bias. k-mers found only in HiFi had a higher GC percentage, while higher frequency k-mers tend to have more AT rich sequences in Illumina. c, Homopolymer length distribution observed in the assembly and in HiFi reads (upper) or Illumina reads (lower) aligned to that position. Longer homopolymers in the consensus are associated with length variability in HiFi reads especially in the GC homopolymers. The majority of the Illumina reads were concordant with the consensus.