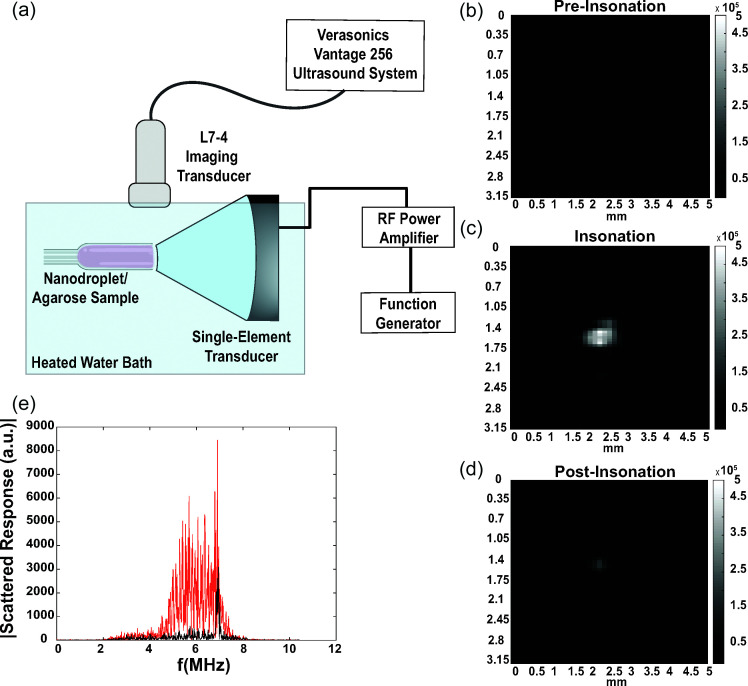
FIG. 1.
Methods used for B-mode image and RF data collection for ADV and IC characterization. (a) Overview of experimental setup. (b), (c), (d) Representative B-mode images of PFCnD phase transitioning and recondensation/dissolution before, during, and after insonation, respectively. Nanodroplets used in these images are 50:50 lipid shelled, 50:50 PFP:PFH nanodroplets. (e) Fourier transform of insonated PFCnDs at 2 MPa peak negative activation pressure (black line, no ADV or IC) and at 9 MPa peak negative activation pressure (red line, evidence of IC).

