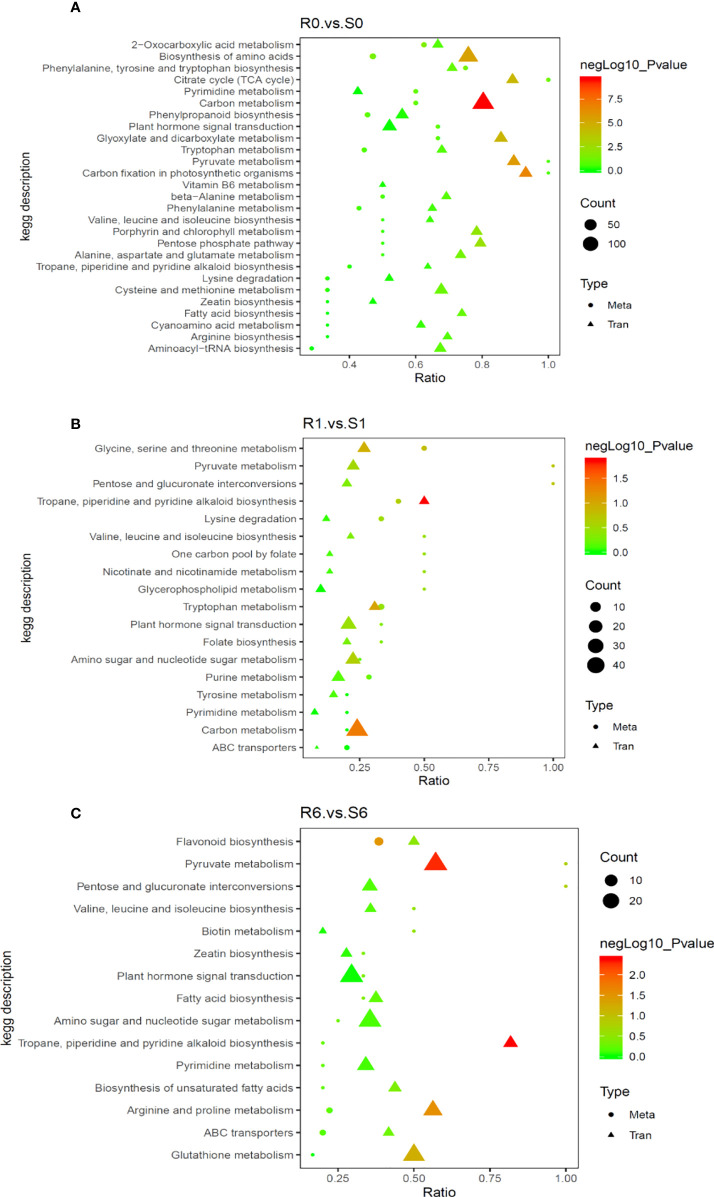
Figure 6.
Correlation analysis of differentially expressed genes and differential metabolites in different KEGG pathways. (A) R0 vs S0 group, (B) R1 vs S1 group and (C) R6 vs S6 group. The abscissa is the ratio of the differential metabolites or differentially expressed genes enriched in the pathway to the number of metabolites or genes annotated in the pathway, and the ordinate is the common enrichment of metabolome-transcriptome. The count is the number of metabolites or genes enriched in the pathway.

