
Figure 4.
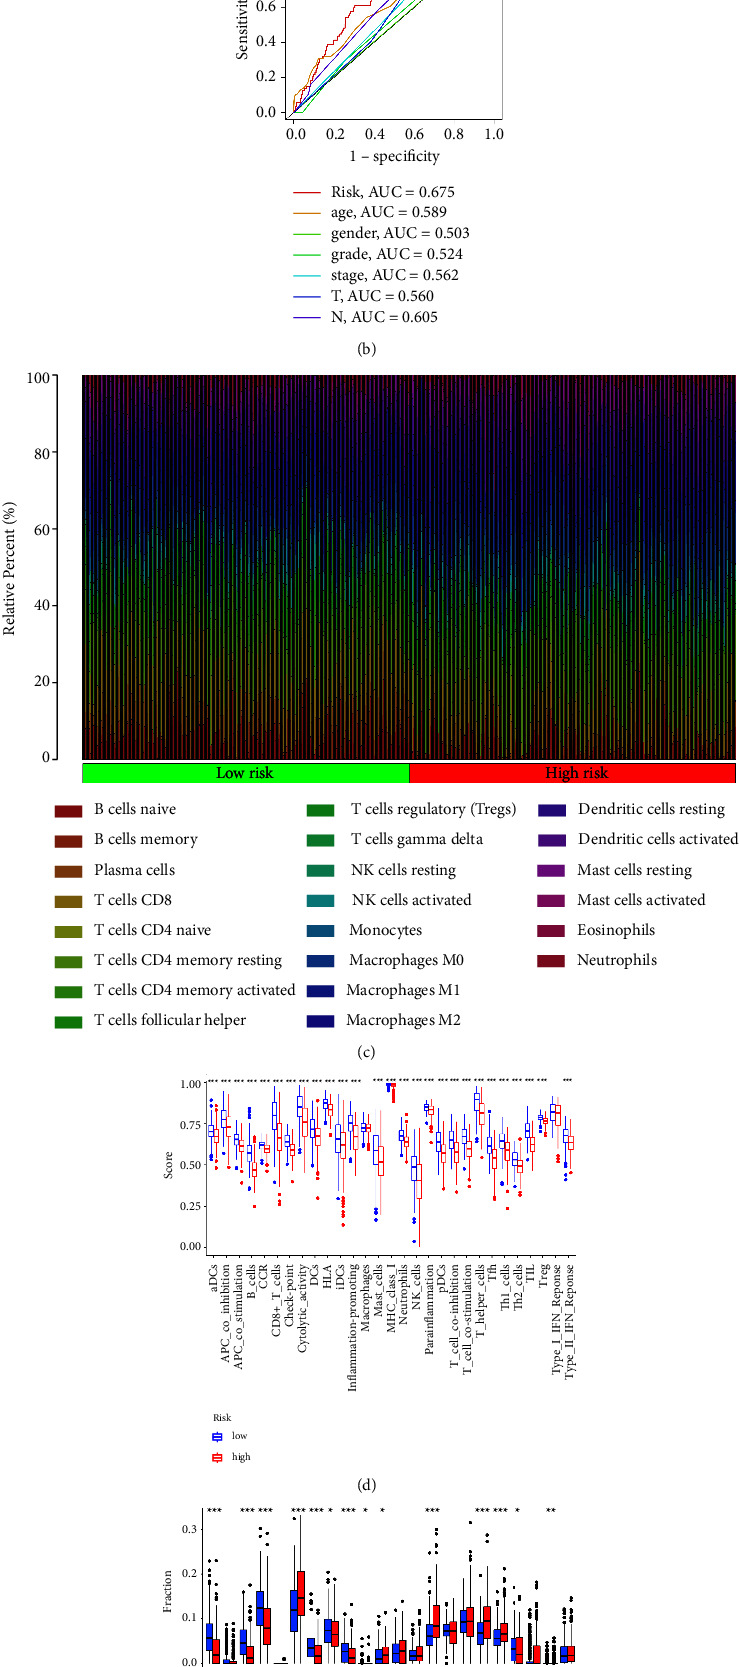
(a) The time-dependent ROC curves reveal the prognostic prediction value of the model; (b) the ROC curve demonstrated the prognostic prediction value of risk scores and clinical characteristics; (c) the different immune cell infiltration between low-risk and high-risk groups; (d) different immune-related functions between low-risk and high-risk groups; (e) the boxplot reveals the correlation between low-risk and high-risk groups.