Figure 6.

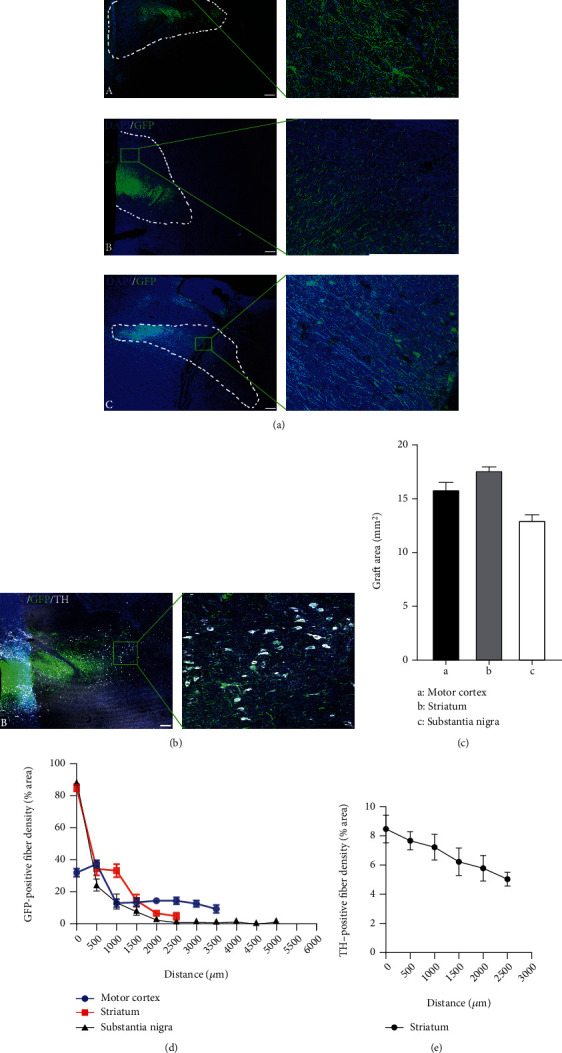
Neurite/axon projection of grafted cells at different brain regions three months following transplantation. (a) GFP-positive cellular grafts were detected in the motor cortex (A), striatum (B), and substantia nigra (C), as well as the magnified insets at areas away from the graft bolus. Scale bars, 1 mm. (b) Immunofluorescence staining of TH. The inset showed the GFP-positive cells that were also positive for TH. Scale bars, 500 μm. (c) The dotted line represents the area of the graft were measured 3 months following transplantation into the brain of the nonhuman primate. (d) Quantification of GFP-positive neurite density as to the distance to the graft injection sites at the three brain regions. (e) Quantification of GFP/TH double-positive neurite density as to the distance to the graft injection site at the striatum.
