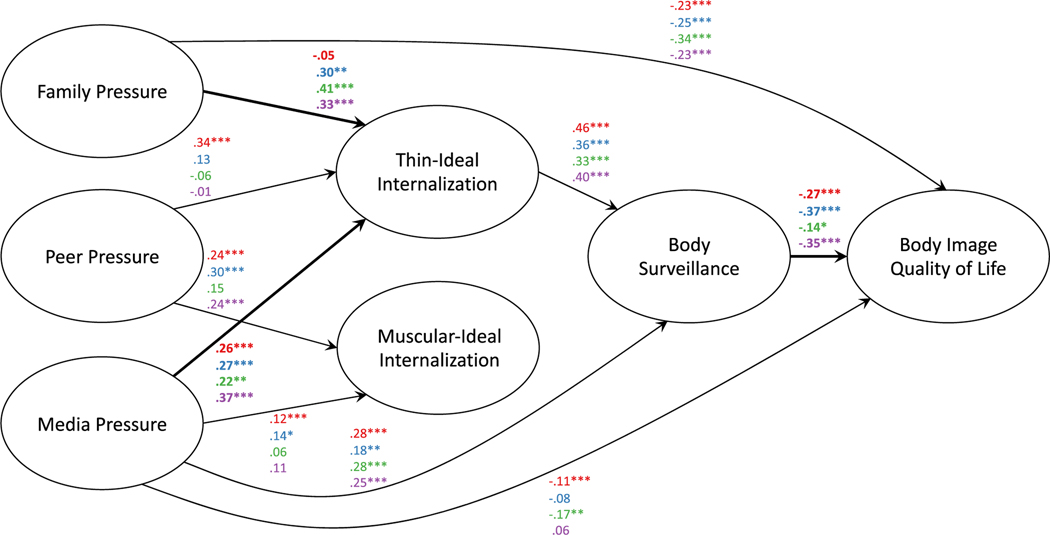
Fig. 3.
Multi-group structural equation model estimates for body image quality of life by race among women. Standardized path estimates are listed in the following order: White (red font), Black (blue font), Hispanic (green font), Asian (purple font). Paths that significantly differed between racial groups are bolded. Arrows for nonsignificant pathways are not shown. * p < .05, * * p < .01, * ** p < .001.

