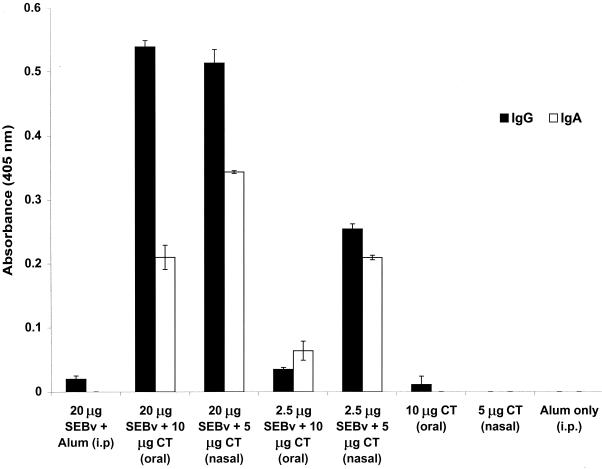
FIG. 3.
Comparison of anti-SEB-specific IgA and IgG in salivary secretions among nasally and orally vaccinated mice given three inoculations with 2.5 or 20 μg of SEBv plus CT. Pooled saliva from each vaccine group (n = 10 mice) and controls given CT was diluted 1:5. Data represent the mean absorbance ± standard deviation of triplicate wells.

