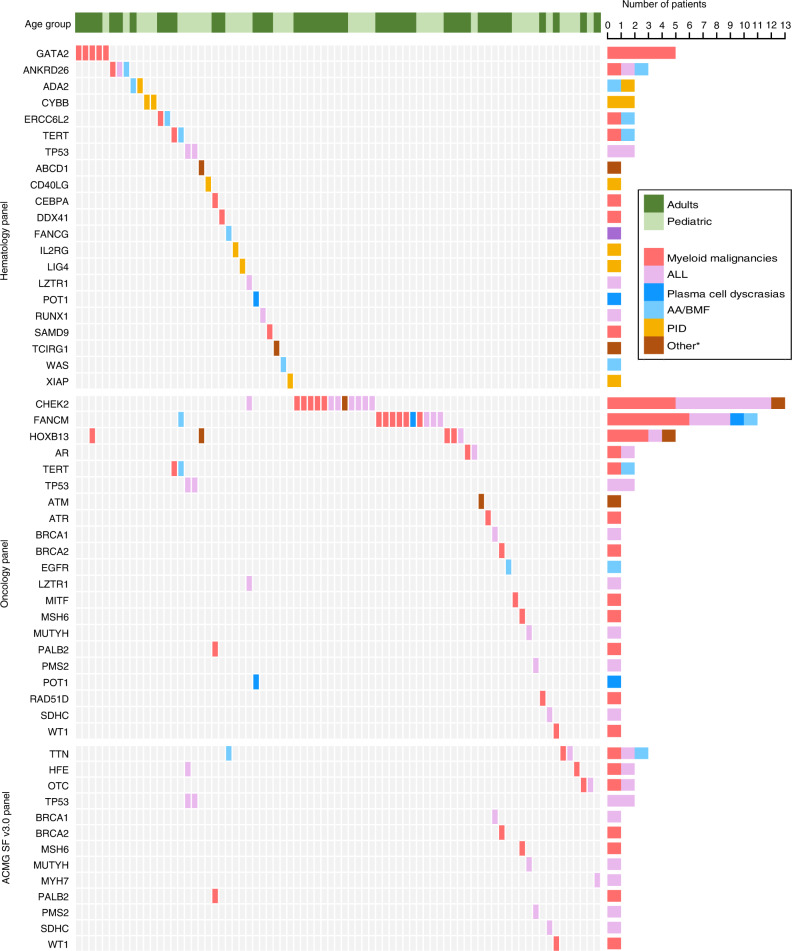
Fig. 1. Visualizing variants as an oncoplot.
Each row represents a gene and each column a patient with one or more rare harmful germline variants. Number of patients with a variant in each gene is demonstrated in the bar plot on the right side. * Other diagnoses include chronic lymphocytic leukemia in adults and osteopetrosis and adrenoleukodystrophy in pediatric patients. ALL – Acute lymphoblastic leukemia, AA – Aplastic anemia, BMF – Bone marrow failure, PID – Primary immunodeficiency.

