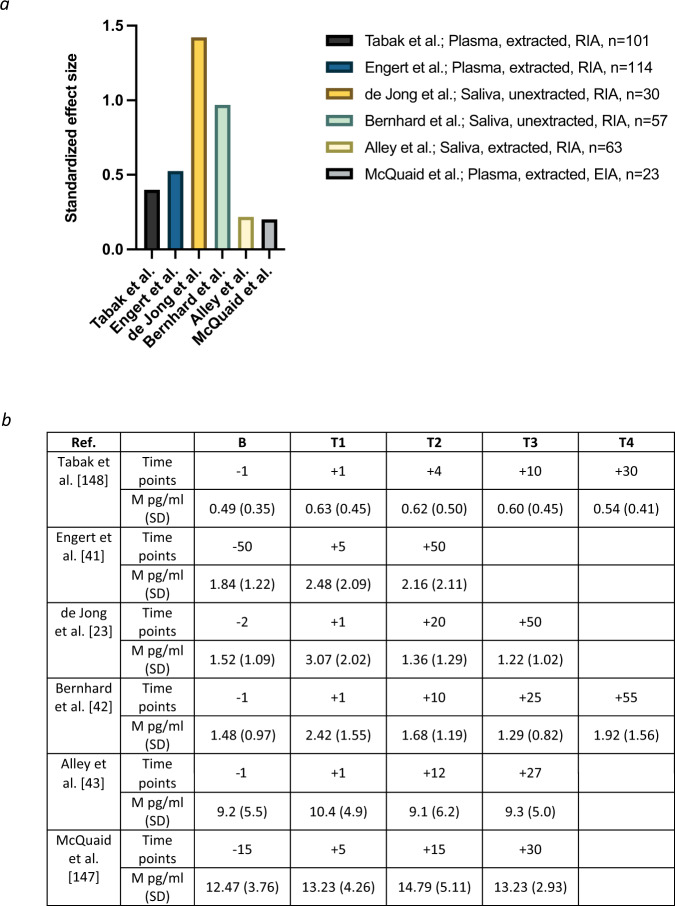
Fig. 2. Examining the magnitude of changes in human oxytocin concentrations following a standardized stress task.
a Changes in human oxytocin concentrations in the Trier Social Stress Test (TSST; [159]) based on scale. b Raw oxytocin values in pg/ml at baseline and post-TSST. The Y-axis shows the standardized effect size as computed by the difference between mean oxytocin levels from baseline (pre-TSST onset) to immediately post-TSST divided by the baseline standard deviation. Alley et al. [43] and McQuaid et al. [154] included all female samples. McQuaid et al. [154] also included a baseline time point at −1, but this occurred before TSST onset, rather than before the instructions were provided—thus, we provide the baseline timepoint before instructions to be consistent with the other studies.

