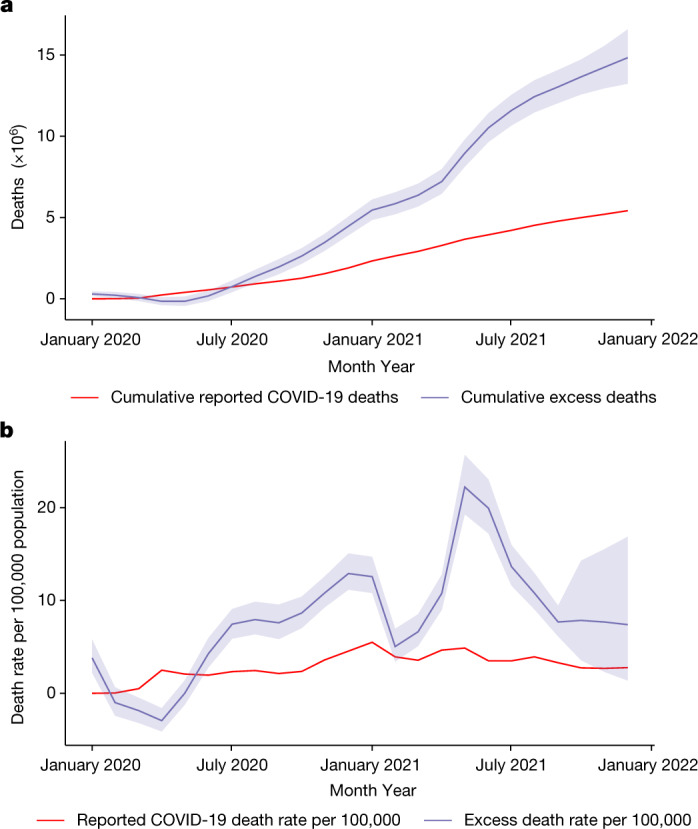
Fig. 1. Global excess and reported COVID-19 deaths and death rates per 100,000 population.

a, Cumulative global excess death estimates and the cumulative reported COVID-19 deaths by month from January 2020 to December 2021. b, Global excess death rates per 100,000 population and the reported COVID-19 death rates per 100,000 population, also by month, from January 2020 to December 2021. On both plots, the central lines of the excess mortality series show the mean estimates and the shaded regions indicate the 95% uncertainty intervals.
