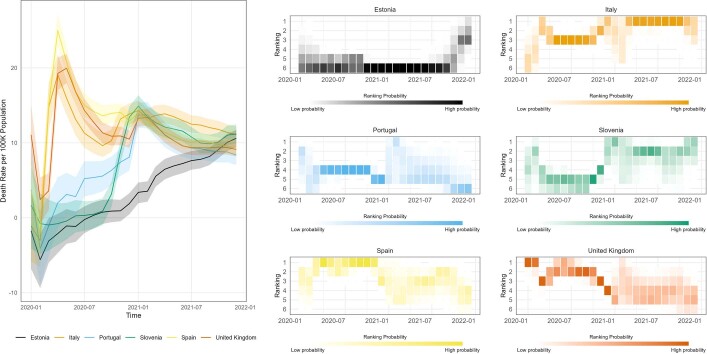
Extended Data Fig. 4. Excess rates over time and ranking probabilities for select countries.
: Left: excess monthly mortality rate (per 100,000 of population), with 95% uncertainty intervals, by month, for six European countries. The panels to the right display the ranking probabilities for each of the individual countries. The probabilities sum to one for each country within each month, i.e., a country has to be in one of the six ranking positions. Also for a fixed month and ranking position across all countries the probabilities sum to one because one of the countries has to be in rank 1, 2, etc, in each month.

