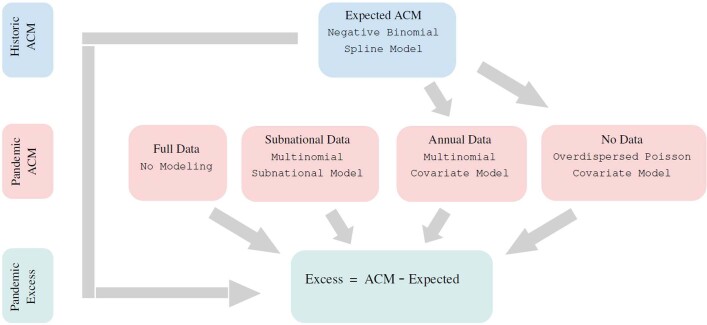
Extended Data Fig. 2. Overview of modelling strategy to produce excess mortality estimates for all countries.
The flowchart outlines how the excess mortality associated with the COVID-19 pandemic is estimated. By definition, this is the difference between the all-cause mortality (ACM) during the pandemic period and that which was expected had the pandemic not occurred (light-green). Starting with the historic monthly ACM data (light-blue) we apply the Negative Binomial Spline model to generate the expected deaths for each country. The data that are available inform the modelling strategy employed to calculate the pandemic period ACM (light-pink). For the places with full data, the reported ACM are taken as is. For those countries with only subnational ACM data, a Multinomial Subnational model is employed to derive national level ACM based on the historic fractions of deaths observed in subnational regions. The overdispersed Poisson Covariate model is fitted to countries with monthly pandemic data, and this model is used to estimate pandemic period ACM for countries without any reported ACM. The covariate model is also used to infer the within-year monthly pandemic ACM in countries with only annual data, via the Multinomial Covariate model.

