
Fig. 2. Cellular senescence hampers muscle regeneration throughout life.
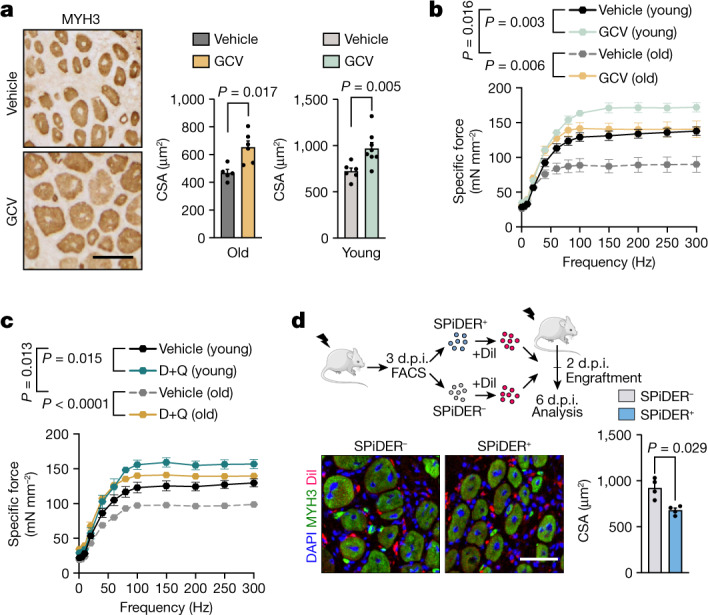
a, Representative images and quantification of the cross-sectional area (CSA) of embryonic myosin heavy chain (MYH3)-positive fibres in regenerating TA from vehicle- or GCV-treated old (n = 5 TA from 3 mice (vehicle) and n = 6 TA from 3 mice (GCV)) and young (n = 6 TA from 4 mice (vehicle) and n = 8 TA from 4 mice (GCV)) p16-3MR mice at 7 d.p.i. b, Specific force–frequency curves of EDL muscles of vehicle- or GCV-treated young (n = 11 EDL from 7 mice (vehicle) and n = 9 EDL from 7 mice (GCV)) and old (n = 5 EDL from 4 mice (vehicle) and n = 7 EDL from 5 mice (GCV)) p16-3MR mice at 10 d.p.i. c, Specific force–frequency curves as described in b, but for vehicle- and D+Q-treated young (n = 8 EDL from 5 mice (vehicle) and n = 7 EDL from 5 mice (D+Q)) and old (n = 5 EDL from 3 mice (vehicle) and n = 7 EDL from 5 mice (D+Q group)) mice at 10 d.p.i. d, An equal number of SPiDER+ or SPiDER− cells from young 3 d.p.i. regenerating muscles were stained with Dil and transplanted into the preinjured TA of young recipient mice for 4 days. n = 4 mice per group. Strategy schematic, representative images and quantification of the CSA of MYH3+ fibres are shown. The schematic in d was created using Servier Medical Art, CC BY 3.0. Scale bars, 50 μm (a and d). For a–d, data are mean ± s.e.m. P values were calculated using two-way analysis of variance (ANOVA) and mixed-effects analysis (b and c) and Mann–Whitney U-tests (a and d).