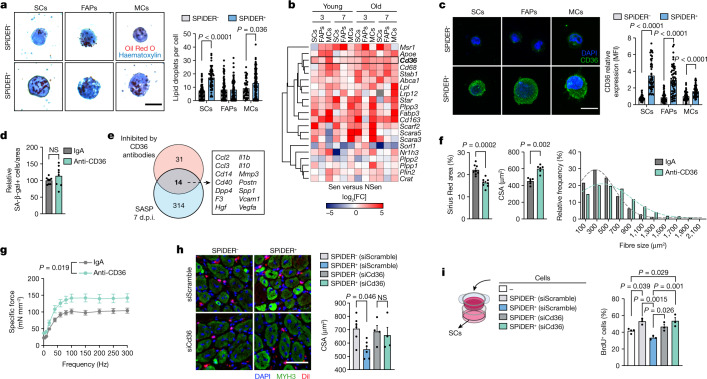
Fig. 6. CD36 neutralization improves muscle regeneration through a senomorphic action.
a, SPiDER+ and SPiDER− populations from 3 d.p.i. muscle stained with Oil Red O and haematoxylin. Images and lipid-droplet quantification. n = 90 SCs (NSen), 51 SCs (Sen), 89 FAPs (NSen), 90 FAPs (Sen), 45 MCs (NSen) and 94 MCs (Sen). b, Heat map showing lipid-transport-related genes that are differentially expressed in at least 3 out of 12 comparisons between Sen and NSen cells. The colour indicates the log2-transformed fold change in expression. c, Images and CD36 quantification in SPiDER+ and SPiDER− populations from 3 d.p.i. muscles. n = 44 SCs (NSen), 50 SCs (Sen), 56 FAPs (NSen), 62 FAPs (Sen), 55 MCs (NSen) and 56 MCs (Sen). d, SA-β-gal+ cells in the injured TA area of aged mice (treated with anti-CD36 antibodies or control IgA). n = 8 TA from 4 mice for both groups. e, The overlap between SASP-upregulated genes in 7 d.p.i. senescent populations of old mice, and those reduced by anti-CD36 treatment. f, The CSA and frequency distribution of MYH3+ fibre size (n = 6 TA from 4 mice for both groups) and Sirius Red staining (n = 8 TA from 4 mice for both groups) of 7 d.p.i. TA from old mice treated with anti-CD36-antibody antibodies or control IgA. g, Injured EDL of old mice treated with anti-CD36 antibodies or control IgA. (n = 6 EDL from 3 mice (IgA) and n = 5 EDL from 4 mice (anti-CD36)). Force–frequency curves are shown. h, SPiDER+ and SPiDER− cells from 3 d.p.i. muscles were transfected with siCd36 or siScramble, stained with Dil and transplanted into the preinjured recipient TA. Images and the CSA of MYH3+ fibres 4 days after transplantation. n = 6 (siScramble-treated SPiDER+ and SPiDER− cells) and n = 4 (siCd36-treated SPiDER+ and SPiDER− cells) mice. i, SCs (from 3 d.p.i. muscles) were cultured for 3 days in Transwells with senescent or non-senescent C2C12 cells that were previously treated with siCd36 or siScramble, or without cells. BrdU incorporation is shown. n = 4 (empty Transwell) and n = 3 (other groups) mice. Scale bars, 10 μm (a and c) and 50 μm (h). For a, c, d and f–i, data are mean ± s.e.m. P values were calculated using Mann–Whitney U-tests (a, c and f), mixed-effects analysis (g) and Tukey’s tests (h and i); NS, not significant.

