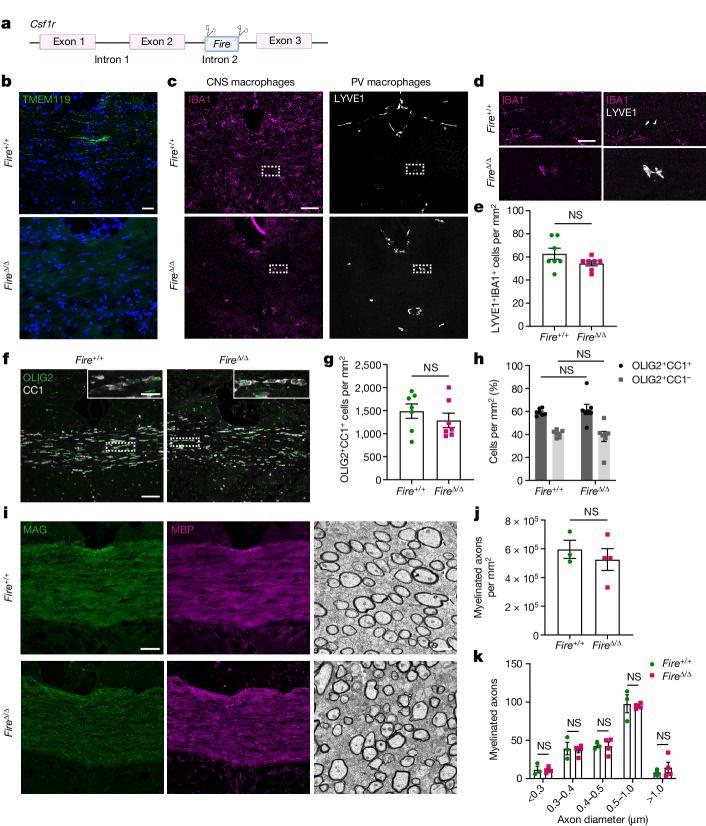
Fig. 1. Microglia are not required for oligodendrocyte maturation and myelination.
a, FireΔ/Δ mice were generated using CRISPR9–Cas9 deletion of the Fire super-enhancer located in intron 2 of Csf1r. b, Images of microglia (TMEM119+; green) in corpus callosum samples from Fire+/+ and FireΔ/Δ mice at 1 month of age, counterstained with Hoechst (blue). c, Images of CNS macrophages (IBA1+; magenta) and perivascular (PV) macrophages (LYVE1+; white) in Fire+/+ and FireΔ/Δ mice. d, Magnified images from c of IBA1+LYVE1+ PV macrophages in Fire+/+ and FireΔ/Δ mice. e, Mean LYVE1+IBA1+ cells per mm2 ± s.e.m. in Fire+/+ and FireΔ/Δ mice. n = 7 mice per group. P = 0.1411, two-tailed unpaired Student’s t-test. f, Images of mature oligodendrocytes expressing both OLIG2 (green) and CC1 (white) in Fire+/+ and FireΔ/Δ mice. Inset shows magnified view. g, Mean OLIG2+CC1+ cells per mm2 ± s.e.m. in Fire+/+ and FireΔ/Δ mice. n = 7 mice per group. P = 0.1990, two-tailed unpaired Student’s t-test. h, Mean proportion of cells of the oligodendrocyte lineage (OLIG2+), which are mature (CC1+; black) or immature (CC1–; grey) (±s.e.m.). n = 7 mice per group. CC1+, P = 0.9472; CC1–, P = 0.9472; one-way analysis of variance (ANOVA) with Tukey’s multiple comparisons test. i, Images of corpus callosum from Fire+/+ and FireΔ/Δ mice stained for the myelin proteins MAG (green) and MBP (magenta) (left and middle) and imaged by electron microscopy (right). j, Mean number of myelinated axons per mm2 ± s.e.m. in corpus callosum from Fire+/+ and FireΔ/Δ mice. n = 3 Fire+/+ mice and 4 FireΔ/Δ mice. P = 0.5216, two-tailed unpaired Student’s t-test. k, Mean number of myelinated axons in corpus callosum from Fire+/+ and FireΔ/Δ mice per axon diameter. n = 3 Fire+/+ mice and 4 FireΔ/Δ mice. P = 0.9139, two-way ANOVA with Sidak’s multiple comparisons test. Scale bars, 25 µm (b,d,i (left and middle)), 75 µm (c,f) and 1 μm (i (right)).

