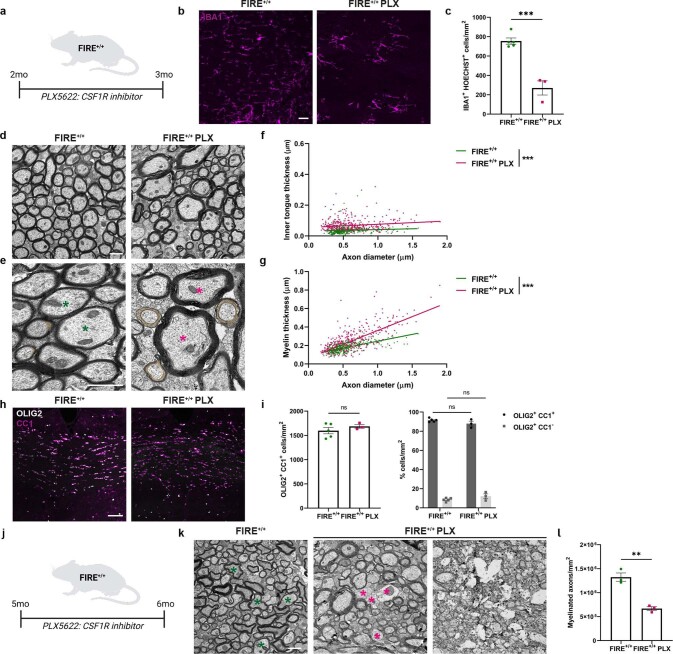
Extended Data Fig. 7. Microglia depletion in adulthood causes hypermyelination and demyelination.
a) Adult FIRE+/+ mice were fed the CSF1R inhibitor PLX5622 in the diet from 2 to 3 months of age. b) Representative images of IBA1+ cells (magenta) in the corpus callosum of 3-month old FIRE+/+ mice on normal diet versus PLX5622 (PLX) diet from 2 to 3 months of age. Scale bar, 25 µm. c) Density of IBA1+ cells/mm2 ± s.e.m. in FIRE+/+ mice on normal diet versus PLX diet at 3 months of age. n = 5 mice on normal diet and 3 mice on PLX diet, ***P = 0.0004, 2-tailed unpaired Student’s t-test, d) Representative images of hypermyelination in the corpus callosum following PLX administration from 2 to 3 months of age. Scale bar, 1 µm. e) Representative images of enlarged inner tongues (orange) and thicker myelin (asterisks) following PLX administration from 2 to 3 months of age. Scale bar, 1 µm. f) Inner tongue thickness (µm) versus axon diameter in FIRE+/+ mice on normal diet or PLX diet from 2 to 3 months of age. n = 100 axons/mouse. n = 3 mice on normal diet and 4 mice on PLX diet. ***P < 0.0001, simple linear regression of intercepts. g) Myelin thickness (µm) versus axon diameter in FIRE+/+ mice on normal diet or PLX diet from 2 to 3 months of age. n = 100 axons per mouse. n = 5 mice on normal diet and 3 mice on PLX diet. ***P < 0.0001, simple linear regression of slopes. h) Images of mature oligodendrocytes co-expressing OLIG2 (white) and CC1 (magenta) in FIRE+/+ mice on normal diet or PLX diet from 2 to 3 months of age. Scale bar, 75 µm. i) Mean OLIG2+ CC1+ cells per mm2 ± s.e.m. in FIRE+/+ mice on normal diet or PLX diet from 2 to 3 months of age. Non-significant, P = 0.3645, 2-tailed unpaired Student’s t-test. Mean proportion of cells of the oligodendrocyte lineage (OLIG2+) which are mature (CC1+; black) or immature (CC1-; grey) ± s.e.m at 3 months. Non-significant, CC1+: P = 0.3779; CC1-: P = 0.3779, 1-way ANOVA with Tukey’s multiple comparisons test. n = 5 mice on normal diet and 3 mice on PLX diet. j) Adult FIRE+/+ mice were fed the CSF1R inhibitor PLX5622 in the diet from 5 to 6-months of age. k) Images of demyelination in the corpus callosum of 6-month-old FIRE+/+ mice (asterisks) following PLX administration from 5 to 6-months of age. Scale bar, 1 µm. l) Mean number of myelinated axons ± s.e.m. in of FIRE+/+ mice on normal diet versus PLX diet from 5 to 6-months of age. n = 3 mice/group. **P = 0.0024, 2-tailed unpaired Student’s t-test.

