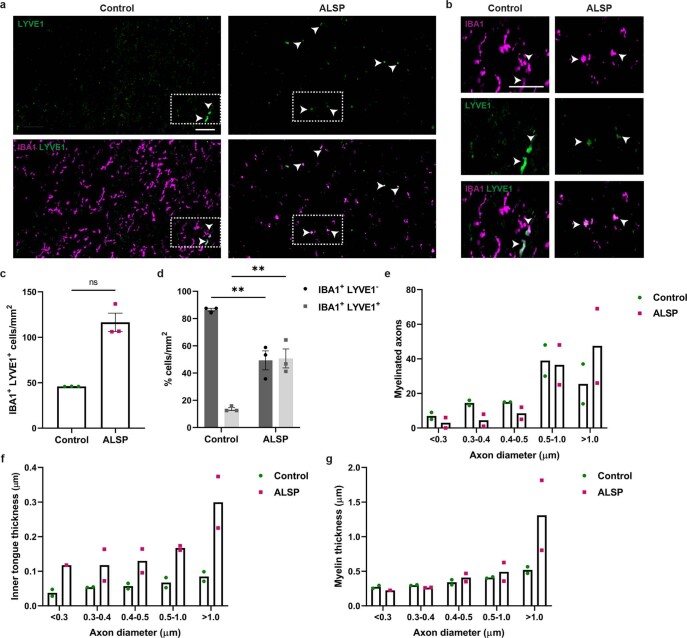
Extended Data Fig. 8. Characterization of ALSP tissue.
a) Images of LYVE1+ (green; top) and IBA1+ (magenta) LYVE1+ macrophages (bottom) in human ALSP and age-matched unaffected control frontal white matter. Scale bar, 50 μm. b) Magnified images from dotted outlines in (A) of IBA1+ LYVE1+ perivascular macrophages in human ALSP and unaffected age-matched control frontal white matter. Scale bar, 50 μm. c) Mean IBA1+ LYVE1+ cells/mm2 ± s.e.m. in ALSP and unaffected control. n = 3 cases/group. P = 0.1000, Mann Whitney test. d) Mean proportion of IBA1+ cells which are perivascular macrophages (LYVE1+; grey) or microglia (LYVE1-; black) ± s.e.m. in ALSP and unaffected control. n = 3 cases/group. **P = 0.0034, 1-way ANOVA with Tukey’s multiple comparisons test. e) Mean number of myelinated axons/axon diameter bin in unaffected control and ALSP patients. n = 2 cases/group. f) Mean inner tongue thickness (µm)/axon diameter bin in Control and ALSP patients. n = 2 cases/group. g) Mean myelin thickness (µm)/axon diameter bin in unaffected control and ALSP patients. n = 2 cases/group.

