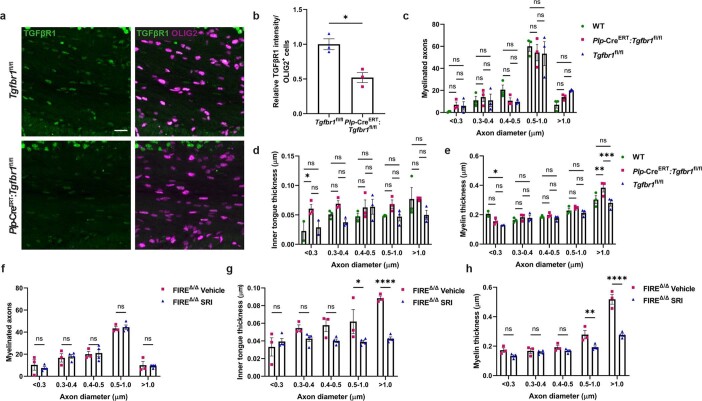
Extended Data Fig. 10. Influence of TGFβ receptor manipulation on myelin health.
a) Images of TGFβR1 expression (green) by OLIG2+ cells (magenta) in corpus callosum of Tgfbr1fl/fl and Plp-creERT;Tgfbr1fl/fl mice, who received 4-hydroxy tamoxifen (OHT; 100 mg/kg/day, P14–18) and were sacrificed at P28. Scale bar, 20 µm. b) Mean relative TGFβR1 intensity ± s.e.m. per OLIG2+ cell in Tgfbr1fl/fl and Plp-creER;:Tgfbr1fl/fl mice. n = 3 mice/group. *P = 0.011, 2-tailed unpaired Student’s t-test. c) Mean number of myelinated axons/axon diameter bin ± s.e.m. in wildtype mice (WT; green), Plp-creERT;Tgfbr1fl/fl mice (magenta) and Tgfbr1fl/fl mice (blue). n = 3 mice/group. Non-significant, P = 0.3001, 2-way ANOVA with Sidak’s multiple comparisons test. d) Mean inner tongue thickness (µm)/axon diameter bin ± s.e.m. in wildtype mice (WT; green), Plp-creERT;Tgfbr1fl/fl mice (magenta) and Tgfbr1fl/fl mice (blue). n-3 mice/group. <0.3 µm WT vs. Plp-creERT;Tgfbr1fl/fl: *P = 0.03950, 2-way ANOVA with Sidak’s multiple comparisons test. e) Mean myelin tongue thickness (µm)/axon diameter bin ± s.e.m. in wildtype mice (WT; green), Plp-creERT;Tgfbr1fl/fl mice (magenta) and Tgfbr1fl/fl mice (blue). n = 3 mice/group. <0.3 µm WT vs. Tgfbr1fl/fl: *P = 0.0291; >1 µm WT vs. Plp-creERT;Tgfbr1fl/fl **P = 0.0037 and Plp-creERT;Tgfbr1fl/fl vs. Tgfbr1fl/fl ***P = 0.0003, 2-way ANOVA with Sidak’s multiple comparisons test. f) Mean number of myelinated axons ± s.e.m./axon diameter bin in 3-month-old FIREΔ/Δ mice following treatment with vehicle control or SRI-011381 hydrochloride from 2 to 3 months of age. n = 3 Vehicle-treated and 4 SRI-treated mice. Non-significant, P = 0.9202, 2-way ANOVA with Sidak’s multiple comparisons test. g) Mean inner tongue thickness (µm) ± s.e.m. per axon diameter bin in 3-month-old FIREΔ/Δ mice following treatment with vehicle control or SRI-011381 hydrochloride from 2 to 3 months of age. n = 3 Vehicle-treated and 4 SRI-treated mice. 0.5-1.0 µm: *P = 0.0334, >1 µm: ****P < 0.0001, 2-way ANOVA with Sidak’s multiple comparisons test. h) Mean myelin thickness (µm) ± s.e.m./axon diameter bin in 3-month-old FIREΔ/Δ mice following treatment with vehicle control or SRI-011381 hydrochloride from 2 to 3 months of age. n = 3 Vehicle-treated and 4 SRI-treated mice. 0.5-1.0 µm: **P = 0.0027, >1 µm: ****P < 0.0001, 2-way ANOVA with Sidak’s multiple comparisons test.

