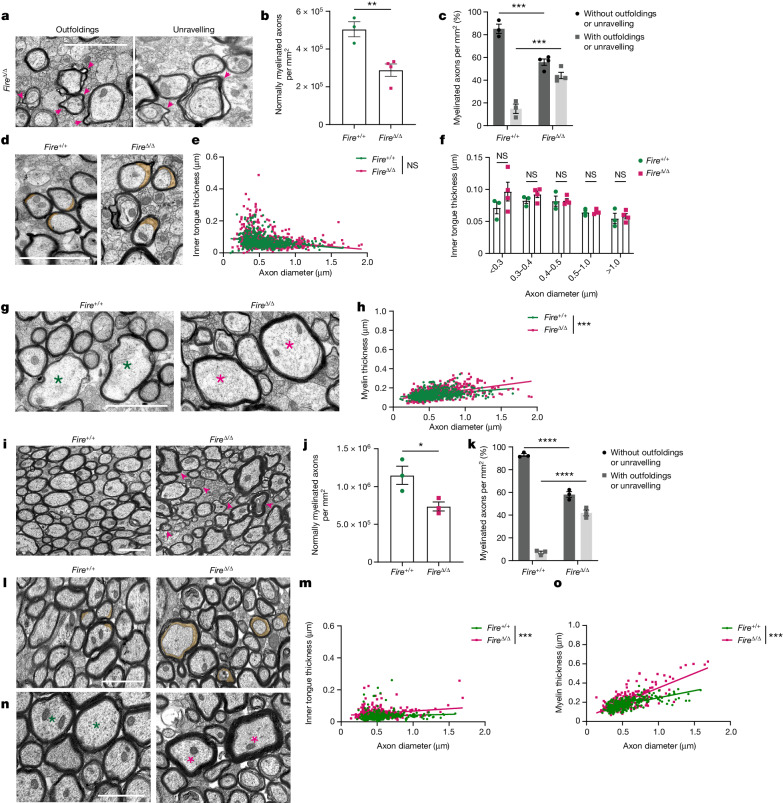
Fig. 2. Microglia regulate myelin growth.
Assessments at 1 month (a–h) and 3–4 months (i–o) of age in Fire+/+ and FireΔ/Δ mice. a, Images of myelin abnormalities (arrowheads) in FireΔ/Δ mice. b, Mean number of normally myelinated axons per mm2 ± s.e.m. n = 3 Fire+/+ mice and 4 FireΔ/Δ mice. **P = 0.008, two-tailed unpaired Student’s t-test. c, Mean proportion of axons with and without outfoldings and unravelling per mm2 ± s.e.m. n = 3 Fire+/+ mice and 4 FireΔ/Δ mice. With, ***P = 0.0006; without, ***P = 0.0006; one-way ANOVA with Tukey’s multiple comparisons test. d, Images of inner tongues (orange). e, Inner tongue thickness (µm) versus axon diameter. n = 200 axons per mouse, 3 Fire+/+ mice and 4 FireΔ/Δ mice. f, Mean inner tongue thickness per axon diameter. n = 3 Fire+/+ mice and 4 FireΔ/Δ mice. P = 0.1099 (<0.3 µm), 0.8933 (0.3–0.4 µm), >0.999 (0.4–0.5 µm), >0.999 (0.5–1.0 µm), 0.9989 (>1.0 µm), two-way ANOVA with Sidak’s multiple comparisons test. g, Images of myelin thickness (asterisks indicate axons of similar size). h, Myelin thickness versus axon diameter. n = 200 axons per mouse, 3 Fire+/+ mice and 4 FireΔ/Δ mice. ***P < 0.0001, simple linear regression of slopes. i, Images of myelin abnormalities (arrowheads) in FireΔ/Δ mice. j, Mean number of normally myelinated axons per mm2 ± s.e.m. n = 3 mice per group. *P = 0.0372, two-tailed unpaired Student’s t-test. k, Mean proportion of axons with and without outfoldings and unravelling per mm2 ± s.e.m. n = 3 mice per group. With, ****P < 0.0001; without, ****P < 0.0001; one-way ANOVA with Tukey’s multiple comparisons test. l, Images of inner tongues (orange). m, Inner tongue thickness versus axon diameter. n = 100 axons per mouse, 3 mice per group. ***P < 0.0001, simple linear regression of intercepts. n, Images of myelin thickness (asterisks indicate axons of similar size). o, Myelin thickness versus axon diameter. n = 100 axons per mouse, 3 mice per group. ***P < 0.0001, simple linear regression of slopes. Scale bars, 1 µm (a,d,g,i,l,n).

