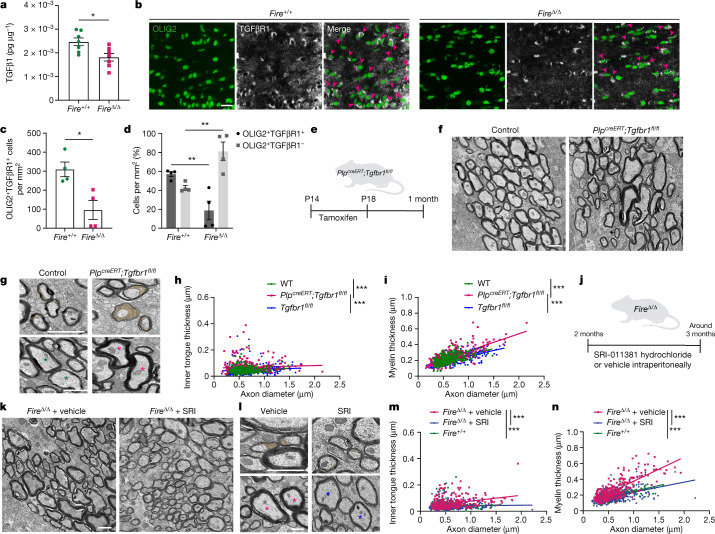
Fig. 6. TGFβR1 signalling regulates myelin integrity.
a, TGFβ1 levels (pg µg–1 ± s.e.m.) in corpus callosum normalized to the respective total protein. n = 7 mice per group. *P = 0.0150, two-tailed unpaired Student’s t-test. b, Images of OLIG2+ cells (green) expressing TGFβR1 (white), (arrowheads) in 1-month-old mice. c, Mean OLIG2+TGFβR1+ cells ± s.e.m. n = 4 mice per group. *P = 0.0144, two-tailed unpaired Student’s t-test. d, Mean percentage of OLIG2+ cells that are TGFβR1+ (black) or TGFβR1– (grey) (± s.e.m.), *P = 0.0120 and *P = 0.0120, respectively, n = 3 mice per group. One-way ANOVA with Tukey’s multiple comparisons test. e, Mice were treated with tamoxifen from P14 to P18 then assessed at 1 month. f, Images of PlpcreERT;Tgfbr1fl/fl mice versus control. g, Images of PlpcreERT;Tgfbr1fl/fl mice, indicating enlarged inner tongues (orange) and hypermyelination (asterisks) compared with control. h, Inner tongue thickness versus axon diameter. n = 100 axons per mouse, 3 mice per group. ***P < 0.0001, simple linear regression of intercepts. PlpcreERT;Tgfbr1fl/fl versus wild type and versus Tgfbr1fl/fl, ***P < 0.0001; wild type versus Tgfbr1fl/fl, P = 0.3228; Kruskal–Wallis with Dunn’s multiple comparisons test. i, Myelin thickness versus axon diameter. n = 100 axons per mouse, 3 mice per group. ***P < 0.0001, simple linear regression of slopes. PlpcreERT;Tgfbr1fl/fl versus wild type, ***P = 0.0008 and versus Tgfbr1fl/fl, ***P = 0.0001; wild type versus Tgfbr1fl/fl, P > 0.9999 Kruskal–Wallis with Dunn’s multiple comparisons test. j, FireΔ/Δ mice were treated with SRI-011381 hydrochloride (SRI; 30 mg kg–1) or vehicle from 2–3 months of age. k, Images of FireΔ/Δ mice treated with vehicle or SRI-011381. l, Images of FireΔ/Δ mice treated with vehicle or SRI-011381 indicating inner tongue size (orange) and myelin thickness (asterisks). m, Inner tongue thickness versus axon diameter. n = 100 axons per mouse, and n = 3 vehicle treated and 4 SRI treated. ***P < 0.0001, simple linear regression of slopes. Vehicle versus SRI and versus Fire+/+, ***P < 0.0001; SRI versus Fire+/+, P = 0.0519, Kruskal–Wallis with Dunn’s multiple comparisons test. n, Myelin thickness versus axon diameter. n = 100 axons per mouse, and n = 3 vehicle treated and 4 SRI treated. ***P < 0.0001, simple linear regression of slopes. Vehicle versus SRI and versus Fire+/+, ***P < 0.0001; SRI versus Fire+/+, P > 0.9999, Kruskal–Wallis with Dunn’s multiple comparisons test. Scale bars, 1 µm (f,g,k,l) or 25 µm (b).

