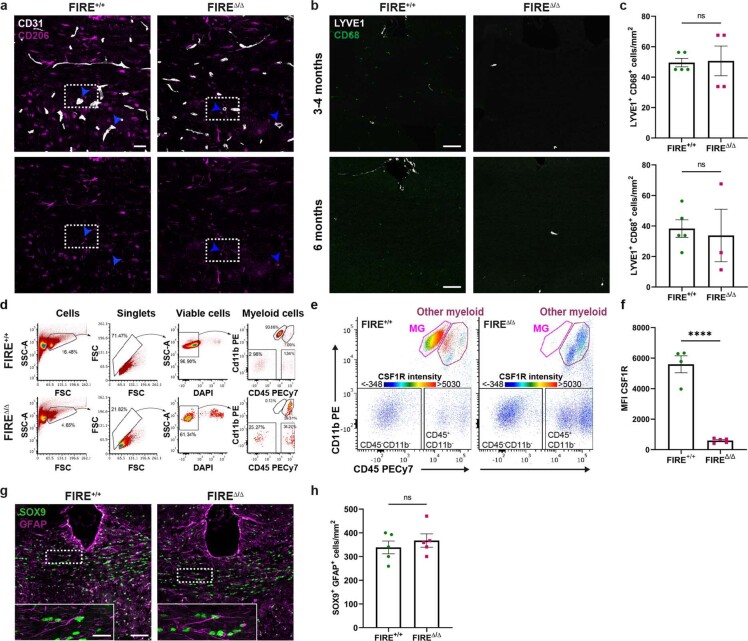
Extended Data Fig. 1. Characterisation of FIREΔ/Δ mouse.
a) Images of perivascular macrophages (CD206+; magenta) in association with blood vessels (CD31+; white)(arrows) in FIRE+/+ and FIREΔ/Δ mouse corpus callosum at 1 month of age. Scale bar, 25 μm. b) Images of perivascular macrophages (LYVE1+ CD68+) at 3-4 months and 6 months of age in corpus callosum. Scale bar, 75 µm. c) Mean density of LYVE1+ CD68+ cells/mm2 ± s.e.m. at 3-4 months and 6 months of age. Non-significant, P > 0.9999 and 0.7698, Mann Whitney and 2-tailed unpaired Student’s t-test, respectively. At 3-4 months, n = 5 FIRE+/+ and 4 FIREΔ/Δ mice, at 6 months, n = 5 FIRE+/+ and 3 FIREΔ/Δ mice. d) Flow cytometry gating strategy for assessment of non-microglial myeloid cells (including BAMs; CD11b+ CD45hi) for panels (e) and (f). e) Intensity of expression of CSF1R in FIRE+/+ and FIREΔ/Δ mice in CD11b+CD45lo microglia (MG) versus CD11b+CD45hi myeloid cells. f) Mean Fluorescence Intensity (MFI) of CSF1R ± s.e.m. in non-microglial myeloid cells (including BAMs) in FIRE+/+ and FIREΔ/Δ mice. ****P < 0.0001, 2-tailed unpaired Student’s t-test. n = 4 FIRE+/+ and 5 FIREΔ/Δ mice g) Images of astrocytes (SOX9; green; GFAP+; magenta) at 1 month of age in the corpus callosum. Scale bar, 75 μm. Inset shows magnified view of double positive cells. Scale bar, 25 μm. h) Mean SOX9+ GFAP+ cells/mm2 ± s.e.m. at 1 month of age in the corpus callosum. n = 5 mice per group. Non-significant, P = 0.4799, 2-tailed unpaired Student’s t-test.

