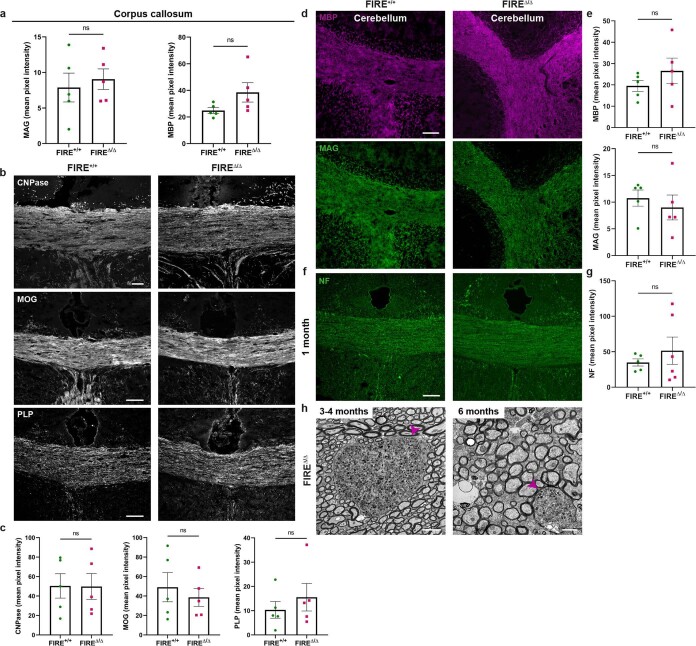
Extended Data Fig. 2. Myelin protein and axonal assessment in the FIREΔ/Δ mouse.
a) Mean pixel intensity of MAG and MBP ± s.e.m. in corpus callosum at 1 month of age. Non-significant, P = 0.6482 and 0.1097 respectively, 2-tailed unpaired Student’s t-test. n = 5 mice/group. b) Images of CNPase, MOG, and PLP (white) in corpus callosum at 1 month of age. Scale bar, 75 μm. c) Mean pixel intensity of CNPase, MOG, and PLP ± s.e.m. in corpus callosum at 1 month of age. Non-significant, P = 0.9758, 0.5699 and 0.4551 respectively, 2-tailed unpaired Student’s t-test. n = 5 mice/group. d) Images of MBP (magenta) and MAG (green) in cerebellum at 1 month of age. Scale bar, 75 µm. e) Mean pixel intensity of MBP and MAG ± s.e.m. in cerebellum at 1 month of age. Non-significant, P = 0.3067 and 0.5462 respectively, 2-tailed unpaired Student’s t-test. n = 5 mice/group. f) Images of neurofilament (NF; green) in corpus callosum at 1 month of age. Scale bar, 75 μm. g) Mean pixel intensity of NF ± s.e.m. in corpus callosum at 1 month of age. Non-significant, P = 0.4623, 2-tailed unpaired Student’s t-test. n = 5 FIRE+/+ and 6 FIREΔ/Δ. h) Images of axonal spheroids in corpus callosum of FIREΔ/Δ mice at 3-4 months and 6 months, indicated with arrows. Scale bar, 2 μm and 1 µm, respectively.

