
Fig. 1.
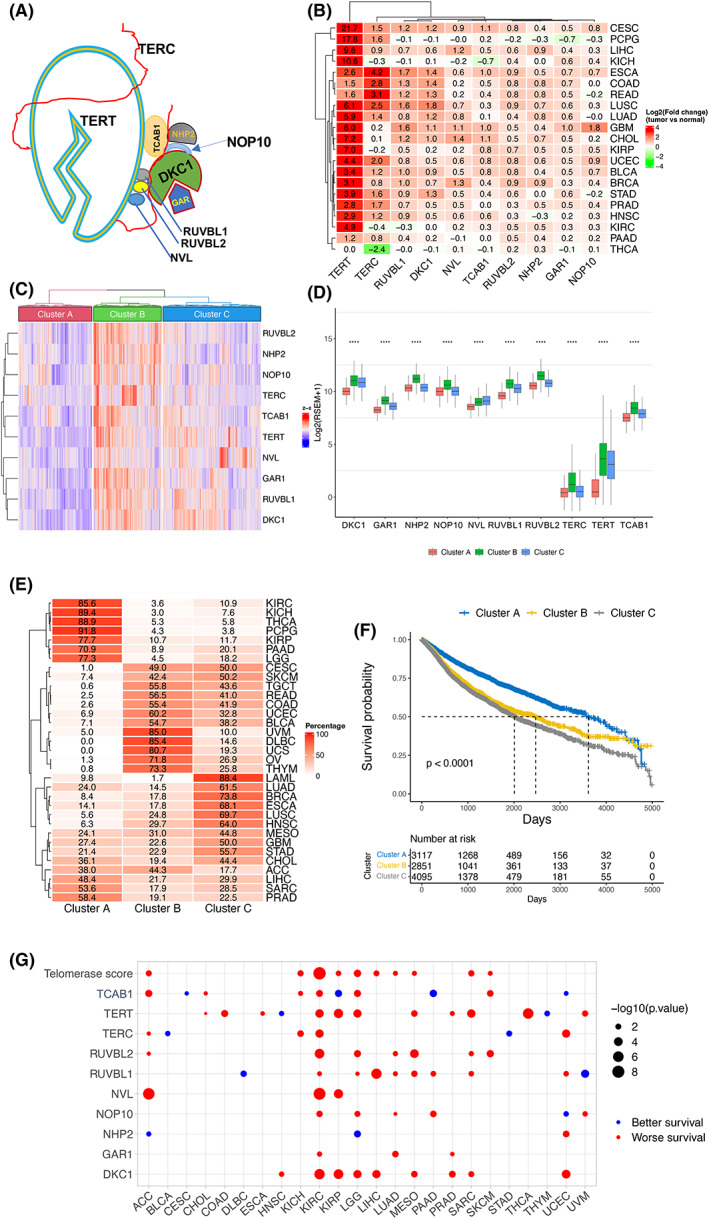
Telomerase component expression‐based stratification of pan‐cancer and association with patient survival. (A) Schematics of the telomerase complex containing 10 telomerase components. (B) Differential mRNA levels of 10 telomerase components between tumors and corresponding adjacent nontumorous tissues (NTs) across cancer types. In 21 of 33 cancer types from the TCGA dataset, ≥3 NTs were available, and shown are expression differences between tumors and NTs. Red and green: higher and lower expression in tumors than in NTs, respectively. (C) The stratification of pan‐cancer according to mRNA levels of 10 telomerase components. Telomerase score (TS), calculated according to telomerase component mRNA levels, was used for unsupervised clustering and three distinct subtypes were revealed: Low (TS‐CA), high (TS‐CB), and intermediate (TS‐CC). (D) Differential mRNA levels of 10 telomerase components in three TS‐subtypes. ****Highly significant differences (P < 0.0001) as determined using the Kruskal–Wallis test. (E) Distribution of three TS‐subtypes across cancer types. (F) Association between TS‐subtypes and patient overall survival (OS) in pan‐cancer. (G) Association between OS and TSs or individual telomerase component expression in each cancer type. Blue and red circle: longer and shorter OS in the groups with higher TS or mRNA levels of telomerase components, respectively.