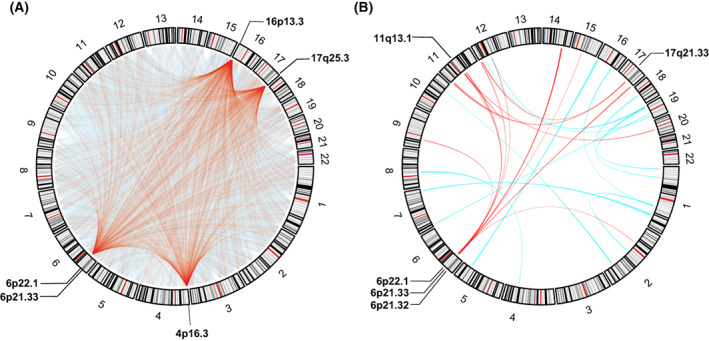
Fig. 2.

The circos plot for visualization of G × G interactions. Results of G × G interactions were given at epigenetic level (A) and transcriptional level (B), respectively. The chords represent interactions exists between two linked chromosome segments, and the chords of the top five enriched regions are highlighted in red.
