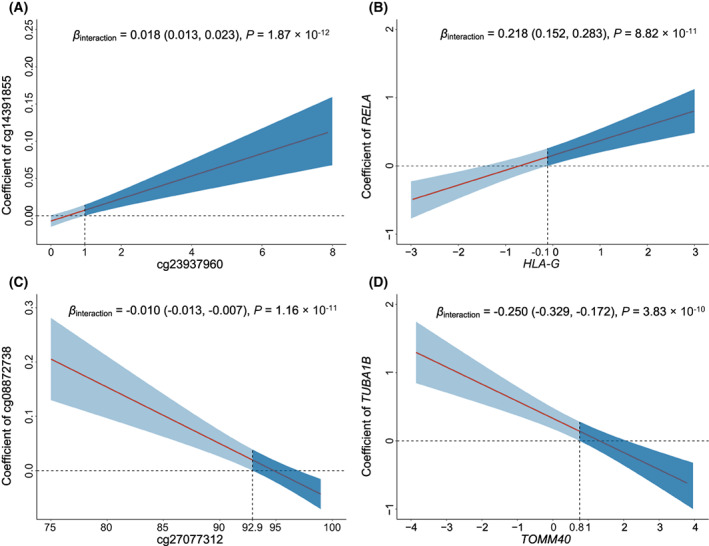
Fig. 3.

Interaction patterns of the screened G × G interactions. Interactions of cg14391855 × cg23937960 (A), which mapped to RELA × HLA‐G (B); as well as cg08872738 × cg27077312 (C), which mapped to TUBA1B × TOMM40 (D) were displayed as the effects of one gene (y axis) varied by the different level of another gene (x axis). Coefficients, 95% CIs, and P values were derived from histology‐stratified Cox proportional hazards models adjusted for age, sex, smoking status, clinical stage, and study centre. The shaded area represents 95% confidence interval. The horizontal dashed line indicates the zero correlation. The vertical dashed line represents the intersection of the lower bound of the 95% CI and the zero correlation.
