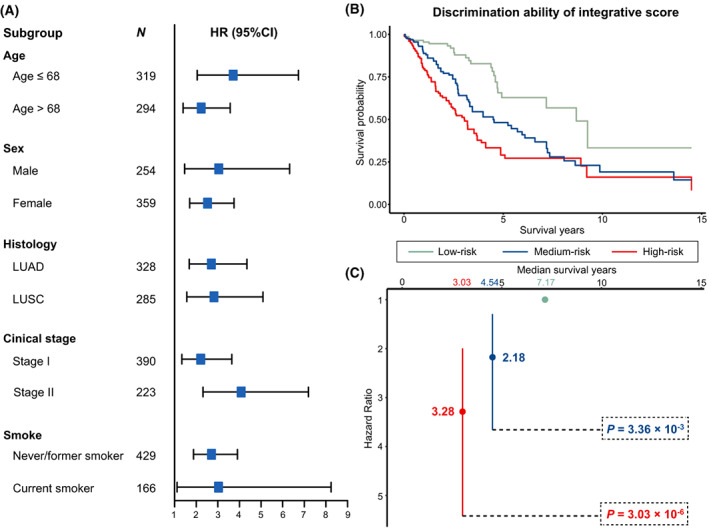
Fig. 6.

Subgroup analysis and discrimination ability of integrative score. (A) Forest plot for subgroup analysis of integrative score stratified by age, sex, histology, clinical stage, and smoke. (B) Discriminative ability of the integrative score, low‐ (N = 204), medium‐ (N = 205), and high‐risk group (N = 204) were defined by tertiles of integrative score. (C) The hazard ratios (HRs) for patients at medium‐ and high‐risk groups when comparing with patients at low risk. Significances were derived from histology‐stratified Cox proportional hazards models adjusted for age, sex, smoking status, clinical stage, and study centre.
