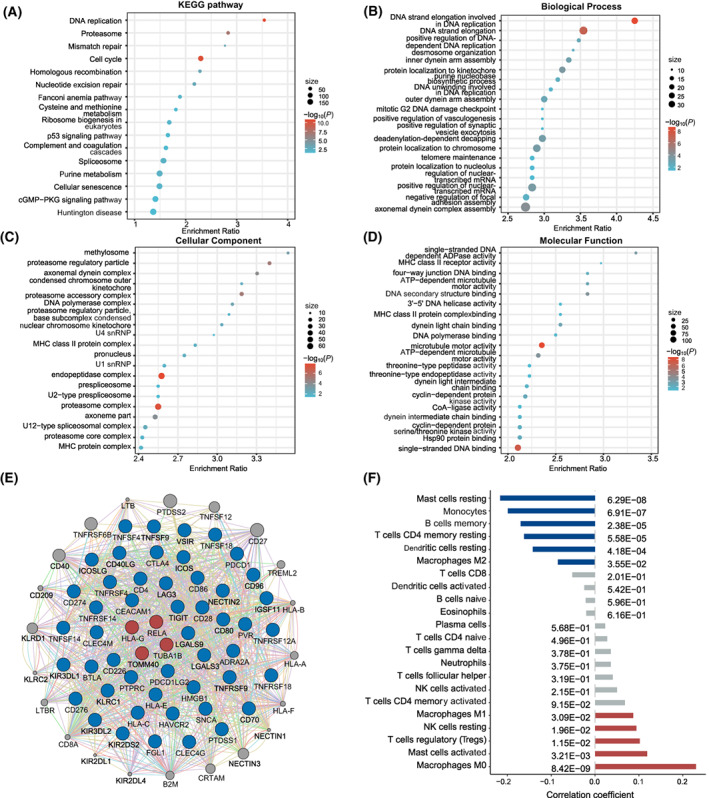
Fig. 7.

In silico analyses for potential biological functions of screened interactions. The functional enrichment analyses for co‐expressed genes of integrative score. (A) 16 significant KEGG pathways. (B) Top 20 significant biological process pathways. (C) Top 20 significant cellular component pathways. (D) Top 20 significant molecular function pathways. (E) Gene network of screened genes and immune checkpoint genes, which constructed by GeneMINIA. The blue circles represents the first neighbours of the screened genes, which suggests direct functional connections. (F) Correlations between proportions of immune cells and integrative score.
