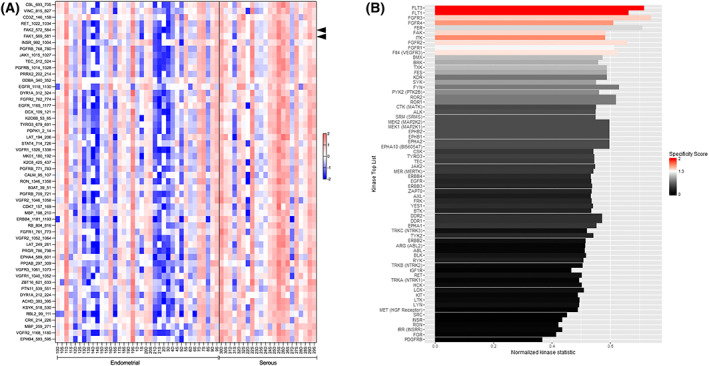
Fig. 1.

Identification of putative tyrosine kinases with differential activities in EEC vs. USC tumor samples. (A) Forty EEC and 22 USC tumor samples were analyzed for tyrosine kinase activity. Equal amounts of tumor protein lysates were analyzed on PTK peptide microarrays. The PTK experiments were performed using a Pamstation PS12 in more than five independent runs with an equal number of samples from each experimental group. Peptide phosphorylation was analyzed using the Bionavigator software. Signal intensities of the phosphorylated peptides were monitored and represented as a z‐scored data. The heat‐map shows the 53 peptides with significant differences in phosphorylation between both groups when compared by t‐test (*P < 0.05). The increase in red color highlights an overall increase in kinase activity in USC samples compared to EEC ones. Of note, FAK1 and FAK2 peptides are highlighted by arrowheads in the figure. (B) List of putative upstream kinases with differential activity between USC and EEC samples. Putative upstream analysis was performed using the bionavigator software ‘Upstream PTK’ module. The length of the bars corresponds to the normalized kinase statistic, a positive value of the kinase statistic indicates higher activity in USC samples. The color of the bars denotes specificity score. Of note, positive kinase statistics means USC samples show higher tyrosine kinase activity compared to EEC ones.
